Skip to content


How do you really measure the quality of your customer service?
Is it based on customer feedback? Retention rates? Or the new customers you gained in the quarter?
For most teams, good service is tickets getting closed, SLAs being hit, or customers getting their orders.
But without benchmarking against industry standards, you are either running blind or living in denial.
You might be delivering slower responses than the industry average, or your resolution rate could be lagging behind peers by weeks.
So how do you really tell the difference between thinking you are doing well and actually knowing it?
Customer service benchmarking is exactly what can help you do that.
Let’s break down how to benchmark your support performance in a practical, measurable, and truly actionable way.
Table of Contents
- What Is Customer Service Benchmarking?
- Why Is Customer Service Benchmarking Important?
- Key Customer Service Metrics to Benchmark
- How to Collect and Analyze Benchmark Data
- How Benchmarking Helps Improve Customer Service
- Frequently Asked Questions
What Is Customer Service Benchmarking?
Customer service benchmarking is the process of comparing your support performance against a defined standard. This is usually industry averages or top-performing teams. It gives you a clear view of where your team stands, what’s working, and what needs to improve.
There are a few different ways to benchmark:
| Type of Benchmarking | What to do | How It Helps | Example |
|---|---|---|---|
| Internal | Track your team’s performance over time | Shows trends and impact of changes | Compare monthly response times or CSAT after adopting a new tool |
| Competitive | Compare your metrics with peers in your industry | Identifies gaps against industry standards | See if competitors resolve tickets faster or score higher on CSAT |
| Functional | Learn from top performers in other industries | Inspires innovative practices and tools | Adopt a support workflow from retail that improves speed in SaaS |
When you’re benchmarking against others, remember that your goal should be to exceed industry standards.
This is also how Shep Hyken, the Chief Amazement Officer of Shepard Presentations, puts it:
Average is not good enough. You’ve got to avoid mediocrity and create moments of magic—experiences just a little better than expected.
Why Is Customer Service Benchmarking Important?
Benchmarking isn’t just about comparing metrics, but it’s ultimately about building a smarter, more responsive support team.
With the right tools, you can do more than measure performance and instead act on it. Here’s why it matters:
Identify performance gaps
Without context, it’s hard to tell if a 12-hour first response time is good or bad, especially based on industry. When you benchmark your metrics against others in the same industry, you’ll know where you stand.
Evaluate performance more effectively
You might be tracking data, but customer service metrics don’t translate into insights without comparing or seeing the bigger picture.
The best way to see the bigger picture with data is to create data reports to view team-level and agent-level performance breakdown. You can see exactly who’s responding fastest, who’s resolving the most queries, and where the bottlenecks are.
💡Did you know?
With Hiver’s reporting feature, you can filter by channel, ticket type, SLAs, or even create custom dashboards to track metrics over time. This helps you keep a pulse on agent performance and overall team performance.

Spot industry trends and best practices
Benchmarks give you visibility into what leading teams are doing differently, whether it’s faster replies, higher CSAT, or more automation.
When you compare it with your team, you also get to identify specific gaps and opportunities to improve. This helps you stay current and competitive.
Recommended reading
Find opportunities to reduce costs
When you create reports and examine the broader picture, you can also identify inefficient workflows or underperforming channels.
This way, you can improve without adding more headcount. For example, if your resolution time is double the industry average, it might be time to streamline your internal processes.
💡Did you know?
Hiver’s email automations help route emails, auto-assign queries, and reduce manual effort without sacrificing quality.

Validate improvement efforts
Apart from finding gaps, you can also measure how your service strategy or improvement tactics are working. If you’ve implemented a strategy, you can benchmark it for a time period, measure its impact over time, and prove whether those changes work.
Compare against competitors
Customers aren’t just comparing your brand based on the last purchase or a random support email. Interaction throughout the customer lifecycle matters, and benchmarks can help you pinpoint these as well.
Benchmarking also helps ensure you’re not falling behind the competition.
Track progress over time
When done regularly, benchmarking can become a way to set future goals, track your team’s progress, and keep your support team moving forward.
You can track the progress over days, weeks, or quarters with customizable reports.
Recommended reading
Key Customer Service Metrics to Benchmark
Benchmarking works well when you’re tracking the right metrics. This includes ones that reflect both your team’s efficiency and your customers’ experience.
Here are the core metrics to focus on, along with what each one tells you:
First Response Time (FRT)
What it is: This is the average time it takes for your team to send the first reply to a customer query. It’s often the customer’s first impression of your service.
💡 Did you know?
As per Hiver’s Customer Service Benchmark Report, 34% of the surveyed support professionals said their First Response Time (FRT) for email queries is less than 1 hour.
Why it’s useful: If this number is high, it usually signals delays in triage or overworked agents. To fix this, teams can implement real-time tracking across shared inboxes and live chat to monitor and reduce FRT using built-in conversation analytics.
Average Resolution Time
What it is: It measures the total time taken to fully resolve an issue, from first contact to final reply. It reflects how efficiently your team can troubleshoot, collaborate, and close tickets.
Why it’s useful: Tracking resolution times across agents and issue types can help identify where issues are getting stuck.
Customer Satisfaction Score (CSAT)
What it is: A CSAT score gives a quick pulse on how customers feel immediately after a support interaction.
44% of service teams believe CSAT is the most important KPI for their team. It’s usually collected through a one-question survey: How satisfied were you with the help you received?
Why it’s useful: CSAT gives you direct feedback on both the quality of the response and the tone of the interaction. You can trigger CSAT surveys automatically after each conversation, and view scores per agent, team, or channel.
💡Pro tip
Send out CSAT surveys with Hiver to gauge what customers think of your service.

Net Promoter Score (NPS)
What it is: NPS measures long-term customer loyalty, based on the likelihood of a customer recommending your brand. While it spans the whole customer journey, support plays a major role.
Why it’s useful: Custom reporting tools let you track NPS over time, correlate it with service interactions, and analyze trends by customer segment.
Customer Effort Score (CES)
What it is: CES tells you how easy or difficult it was for a customer to get their issue resolved. It often correlates more closely with loyalty than CSAT.
Why it’s useful: If customers have to repeat themselves, get transferred, or search too hard for answers, CES will show it.
Ticket Volume per Agent
What it is: Tracks how many queries each agent is handling within a given period.
Why it’s useful: It helps assess workload distribution and identify if certain team members are overburdened or underutilized. Reporting tools that break down performance by user make this easier to manage.
Recommended reading
SLA Adherence Rate
What it is: Service Level Agreements (SLAs) define the response and resolution times your team promises to meet.
Why it’s useful: This metric shows how often those targets are actually being hit. You can set custom SLAs for different issue types or customers, and use SLA timers to stay accountable.
💡Did you know?
You can set SLA targets with Hiver to ensure your team stays on top of their tickets and resolves issues promptly.
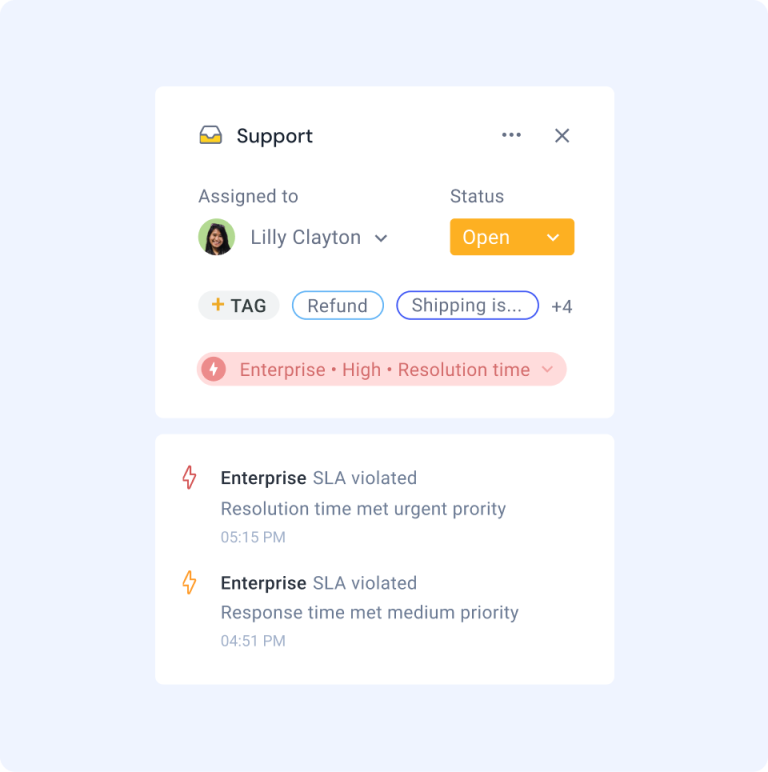
📌 Real-world example:
Czech online travel agency, Kiwi.com, faced many challenges as they were managing over 1,500 partner emails a month through shared inboxes with no visibility or accountability, leading to missed messages and SLA breaches.
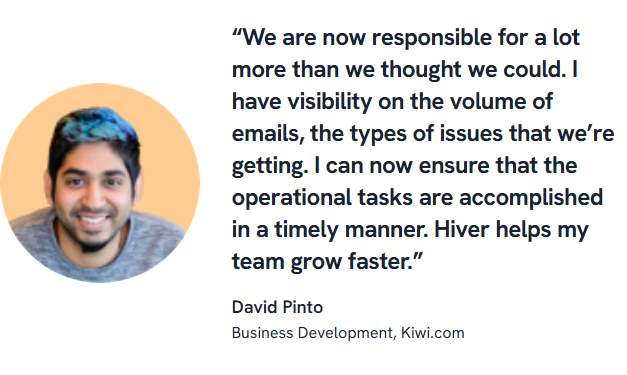
By adopting Hiver’s omnichannel inbox with automated assignment, status tracking, and analytics, they streamlined workflows, improved oversight, and achieved 100% compliance with their 24-hour SLA.
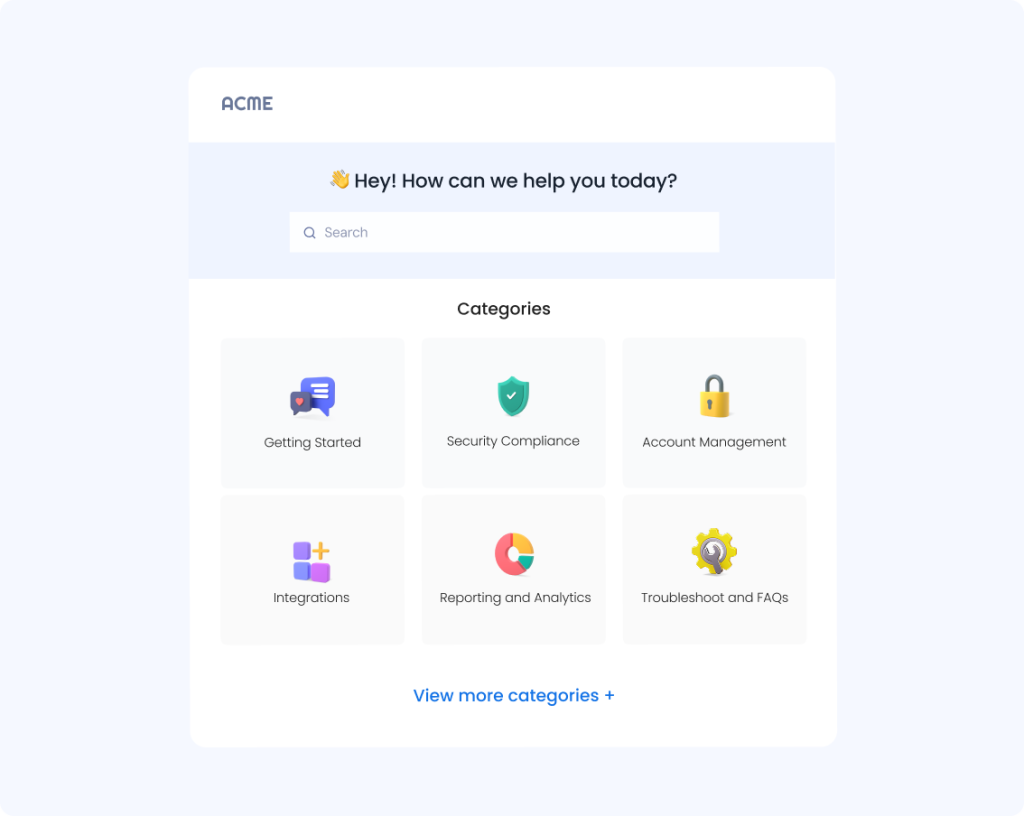
Self-Service Score (Knowledge Base Effectiveness)
What it is: This reflects how often customers resolve issues without needing to contact support, usually through your help center or FAQs.
You can track this by looking at knowledge base usage, deflection rates, and follow-up contact volume.
Why it’s useful: This metric helps identify opportunities to deflect routine inquiries, allowing agents to focus on complex issues while giving customers faster solutions without waiting in queue.
💡Pro tip
Set up and maintain knowledge bases with Hiver to offer customers with the info they need right away.
How to Collect and Analyze Benchmark Data
Let’s say you lead support operations at a mid-sized fintech company. The team’s been running smoothly, but your NPS has dipped. Leadership wants to know: Are you underperforming, or is this just normal for the industry?
That’s where benchmarking comes in. Here’s how to approach it, step by step:
Step 1: Pick What You Want to Benchmark
You don’t need to benchmark everything at once. Start with a specific area you care about, like First Response Time, CSAT, or Resolution Time. Choose something that’s closely tied to your goals, whether it’s improving customer loyalty or reducing agent workload.
Step 2: Choose the Right Metrics
Focus on metrics that clearly reflect both customer experience and operational efficiency. CSAT and CES are great for sentiment. FRT and resolution time reflect speed. SLA adherence shows consistency. A good support reporting tool will enable you to track these in real-time and over custom periods.
Recommended reading
Step 3: Identify a Benchmark Source
Instead of relying on generic stats from scattered sources, look for a reliable industry-specific report.
For example, the Customer Service Benchmarking Report from Hiver breaks down real-world data across key metrics, based on responses from 500+ support leaders.
That way you’re comparing apples to apples and setting the right targets for your support team.
Step 4: Collect Internal Data
Now it’s time to look inward. Pull your internal numbers from your helpdesk, shared inbox platform, or CRM. A tool with built-in reporting can make this easier, especially one that shows trends by agent, team, channel, or customer segment.
💡Pro tip
Hiver’s reporting analytics gives you a complete overview on agent performance and key metrics across the team.

Step 5: Compare and Analyze
This is where the lightbulb moment happens. Line up your internal metrics next to the benchmark.
Are your response times slower than the industry average? Is your CSAT on par with others in the same industry? This analysis gives you clarity on where to focus and the type of targets to set.
Step 6: Plan Your Next Steps
Let’s say the data shows you’re resolving tickets more slowly than your peers. Dig into the ‘why’. Perhaps it’s a lack of internal documentation or repetitive queries that could be handled more efficiently with better automation. That insight becomes your action item.
As a response, update your knowledge base. Build response templates. Set new SLA goals. Tools that support workflow automation, SLA tracking, and in-line help article sharing can accelerate that improvement.
Most importantly, treat benchmarking as a continuous cycle instead of a one-time exercise. Keep measuring your performance. Compare progress over time and against peers. Use what you learn to improve your processes. With each cycle, you build an advantage that compounds — making your support team more efficient.
How Benchmarking Helps Improve Customer Service
Benchmarking is more than just checking numbers. It’s a way to turn data into action and create better service experiences at every touchpoint.
By comparing your performance against industry standards, you gain insights into where you excel and where improvements are needed.
This process helps teams identify bottlenecks, set realistic goals, and make data-driven decisions that directly impact customer satisfaction.
The most successful organizations make benchmarking an ongoing practice rather than a one-time exercise. When used alongside tools like Hiver that help with reporting, CSAT tracking, and workflow optimization, benchmarking becomes a powerful engine for continuous improvement.
Wondering how you can measure and compare against industry benchmarks for customer service? Start with tracking the right metrics today. Try Hiver’s 7 day free trial today.
Frequently Asked Questions
What is the benchmark for customer service?
Benchmarks vary, but here are some general targets.
-First Response Time: Under 6 hours for email, under 1 minute for live chat
-Resolution Time: Within 24 hours
-CSAT: 85% or higher
-SLA Adherence: Above 90%
What are some customer service benchmarks by industry?
Benchmarks shift based on industry, team size, and support complexity. For example:
-E-commerce: Fast response times, high volume, CSAT around 85–90%
-SaaS: Focus on resolution accuracy, lower ticket volume, CSAT > 90%
-Fintech: Slightly slower resolution, higher emphasis on precision, and SLA adherence
What are the 5 key performance indicators for customer service?
The five most commonly tracked KPIs are:
-First Response Time – How quickly your team replies to incoming queries
-Average Resolution Time – How long does it take to fully close a ticket
-Customer Satisfaction Score (CSAT) – Measured via post-conversation surveys
-Net Promoter Score (NPS) – Measures long-term customer loyalty
-SLA Adherence – Tracks how often your team meets promised response or resolution time
Start using Hiver today
- Collaborate with ease
- Manage high email volume
- Leverage AI for stellar service