Skip to content


Live chat is now the default channel for customer support. 41% of consumers prefer it over phone, email, and social media combined, and it leads every other channel on satisfaction scores.
So when companies invest in live chat, they naturally reach for the easiest metrics to track: How fast did we respond? How long did customers wait? These numbers are easy to pull and easy to report upward.
But speed alone is a dangerously incomplete picture.
A 10-second first response time means nothing if the agent opens with the wrong question. An average wait time under a minute looks great, until you see 30% of those chats closing without resolution. A team hitting FRT targets every day can still be quietly bleeding CSAT, missing conversions, and burning out agents.
At Hiver, live chat is one of our primary support channels, and the metrics we track mirror exactly what we’ve seen work across the support teams we speak with.
The 15 metrics in this guide are drawn from that experience and from conversations with support leaders who are doing this well.
What Are Live Chat Metrics?
Live chat metrics are the quantitative indicators that tell you how well your chat support is performing — across speed, quality, agent efficiency, and revenue impact.
They go beyond activity counts to measure outcomes: Was the customer’s issue resolved? How quickly? Did the agent have the capacity and context to do it well?
Think of them as a three-layer picture: how fast you respond, how well you resolve, and how much value you create.
Tracked together, they connect your support operations directly to customer experience, and give you a clear signal on where to improve.
Recommended reading
Why Should You Track Live Chat Metrics?
Tracking the right chat metrics does four crucial things for your business:
- Improve response speed: Monitoring First Response Time and Average Wait Time surfaces staffing gaps and routing inefficiencies before customers feel them. Studies suggest that when companies reply within 5–10 seconds, satisfaction rates jump to over 85%.
- Improve customer satisfaction: CSAT and NPS give you a direct signal on experience quality, and live chat already outperforms on this. It has an 88% CSAT rate versus 61% for email. But channel reputation can only carry you so far; measuring and acting on satisfaction scores is what sustains it.
- Identify upsell and cross-sell opportunities: Support conversations are often the highest-trust touchpoint a customer has with your brand. Tracking chat outcomes lets you identify natural moments where agents can recommend a relevant upgrade or add-on – not as a sales push, but as a genuine resolution extension. Teams that monitor these moments see chat evolve from a cost center into a retention and expansion driver.
- Optimize team efficiency: Agent utilization rate, concurrent chats, and tickets per agent tell you whether your team is appropriately staffed or heading toward burnout.
Recommended reading
10 Reasons to Add Live Chat Support to Your Business (2025 Guide)
15 Live Chat Metrics to Track in 2026
Here are the 15 live chat metrics that should be on your dashboard in 2026.
1. First Response Time (FRT)
First Response Time is how long it takes for an agent to send the first reply after a customer initiates a chat.
Why it matters: FRT is the metric customers feel most immediately. An unacknowledged chat feels like being ignored. Beyond perception,60% of customers expect a response within 10 minutes.
Benchmark:According to reports, top performers respond in under 40 seconds. Industry average sits around 2 minutes.
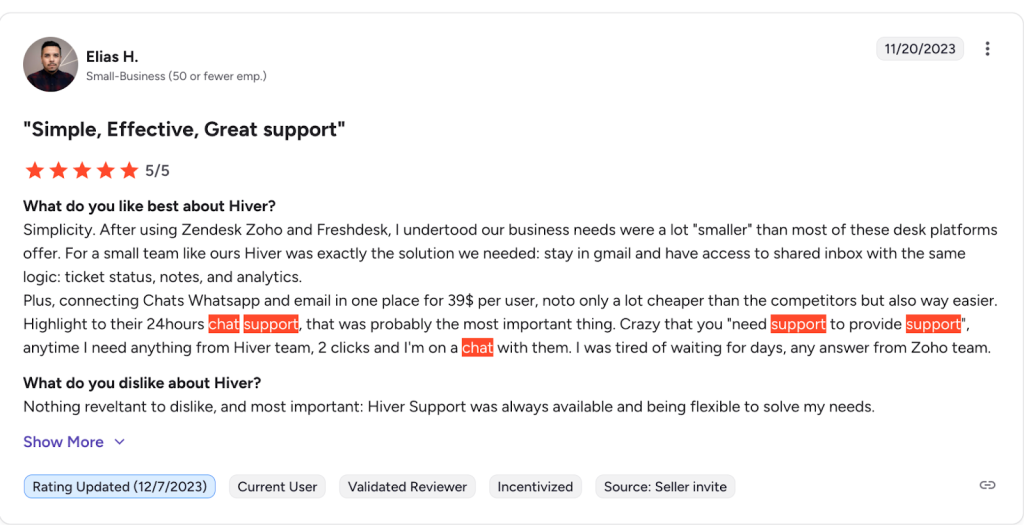
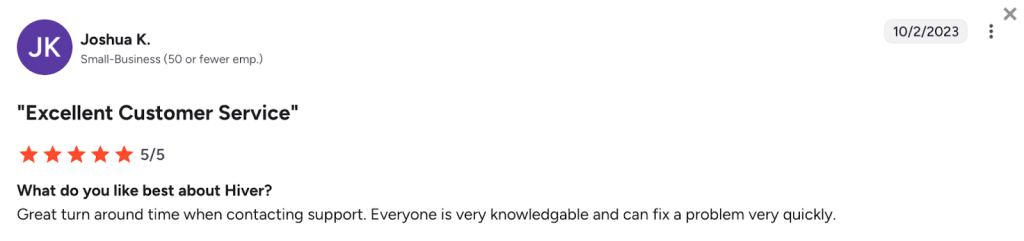
At Hiver, our own support team maintains a First Response Time of under 30 seconds on live chat.
Check out what a customer has to say about Hiver’s chat support on G2:
Formula:
FRT = Sum of all first response times ÷ Total number of chats
How to improve First Response Time:
- Use automated greetings to acknowledge customers instantly while agents catch up. Something like: “Hi! Thanks for reaching out. One of our support agents will be with you in just a moment.” This simple acknowledgment resets the customer’s psychological wait clock and reduces the chance they’ll abandon the queue before an agent picks up.
- Implement intelligent chat routing to send chats to the right agent from the start. For example, if a customer’s account is flagged as an enterprise plan, the chat routes directly to your senior support tier – not the first available agent.
- Monitor staffing during peak hours so wait time doesn’t spike undetected.
2. Average Response Time
Average Response Time is the average time between each customer message and the agent’s reply across the entire conversation — not just the first one.
Why it matters: FRT tells you how fast you start; average response time tells you how fast you can sustain momentum in the chat. A great first reply followed by 4-minute lags in the middle of a conversation tanks satisfaction just as surely. It’s a truer measure of conversational quality.
Benchmark: The average benchmark for Average Response Time is approximately 37 seconds across all sectors. E-commerce and SaaS teams, where immediacy is more critical, typically aim for sub-30 seconds.
At Hiver, our average chat response time is 13 seconds; nearly 3x faster than the industry average of 45 seconds.
Check out this user’s review on G2.
Formula:
Average Response Time = Total time between all customer messages and agent replies ÷ Total number of exchanges
How to improve Average Response Time:
- Train agents on efficient typing and use canned responses for common queries.
- Flag conversations where response lag exceeds a threshold in real time.
- Use AI to draft suggested replies agents can send or edit quickly.
3. Average Wait Time
Average Wait Time measures how long a customer waits in the queue before being connected to an agent.
Why it matters: Wait time is the gap between customer intent and service delivery. A customer ready to buy or frustrated with an issue doesn’t wait graciously. In fact, 53% of customers abandon a chat if they have to wait longer than 5 minutes. This metric is a direct indicator of staffing health and queue management.
Benchmark: Under 1 minute is excellent; under 3 minutes is generally acceptable.
Formula:
Average Wait Time = Total time all customers spent in queue ÷ Number of chats answered
How to improve Average Wait Time:
- Deploy AI chatbots to handle common queries and reduce human queue pressure.
- Set queue-based staffing triggers so extra agents come online at volume spikes. For example, if more than 5 chats are waiting simultaneously or average wait time exceeds 90 seconds, a Slack notification fires to two on-call agents to log in and assist.
- Offer a callback or async option when wait times exceed your threshold.
4. Average Resolution Time
Average Resolution Time is the total time from when a chat starts to when the issue is fully resolved and the chat is closed.
Why it matters: Fast first replies matter, but customers judge support by whether their problem got solved — and how long it took. Studies show that companies with low resolution times consistently rank higher in customer satisfaction surveys, while those with high resolution times often lead to repeat inquiries and lower CSAT.
Benchmark: Under 10 minutes for simple issues; under 1 hour for complex ones.
Formula:
Resolution Time = Chat close timestamp − Chat start timestamp
How to improve Average Resolution Time:
- Equip agents with a searchable knowledge base accessible during conversations.
- Use AI to surface relevant help articles in real time as the issue unfolds.
- Reduce unnecessary escalations through better agent training on common issues.
Recommended reading
How to Reduce Average Handle Time (AHT) Without Sacrificing Quality
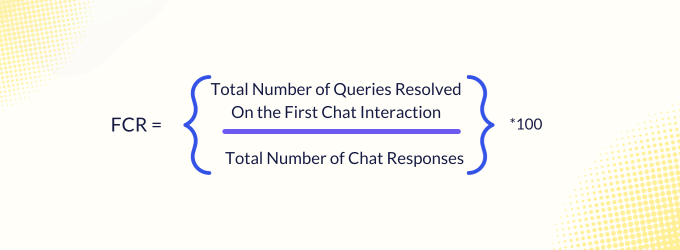
5. First Contact Resolution (FCR)
FCR is the percentage of chat conversations resolved in a single interaction, without the customer needing to return, escalate, or follow up.
Why it matters: FCR is one of the highest-leverage metrics in support. According to a study by the SQM Group, every 1% improvement in FCR correlates with a 1% improvement in CSAT. It reduces repeat contacts, cuts support costs, and signals that agents are empowered and well-equipped.
Benchmark: Cross-industry average FCR is 70%, with top performers reaching 80–85%. SaaS and technology teams typically land between 65–75%.
Hiver’s First Contact Resolution rate is 88%.
Formula:
FCR (%) = (Chats resolved on first contact ÷ Total chats) × 100
How to improve First Contact Resolution:
- Train agents on a broad range of issues so escalations are genuinely last resort. For example, run bi-weekly syncs between your support team and the product team so agents stay current on new feature releases, known bugs, and upcoming changes before customers ask about them. Pair this with monthly internal case reviews where the team walks through escalated chats and asks: could this have been resolved at tier 1? Over time, this closes the knowledge gaps that force unnecessary escalations.
- Give agents real-time access to customer history, account data, and product documentation. Help desk platforms like Hiver and Pylon surface customer history, account details, and relevant documentation directly within the chat window — so agents have everything they need without leaving the conversation. The result is faster, more confident responses that don’t require a follow-up.
- Review recurring FCR failures to spot systemic knowledge gaps. Use those findings to create or update knowledge base articles, so the next agent who encounters the same issue has a clear, accurate answer ready. This turns your FCR data into a continuous improvement loop for your self-serve content.
6. Customer Satisfaction Score (CSAT)
CSAT measures how satisfied customers are with their chat experience and it is typically collected immediately after a conversation.
Why it matters: CSAT is the most direct measure of how your customers feel about the support they received. It’s named the most important metric by both chat users and agents. A high CSAT score of 75%+ is a reliable indicator that your live chat is actually serving customers well.
Benchmark: 75–85% is good; 80%+ is generally considered excellent across most industries.
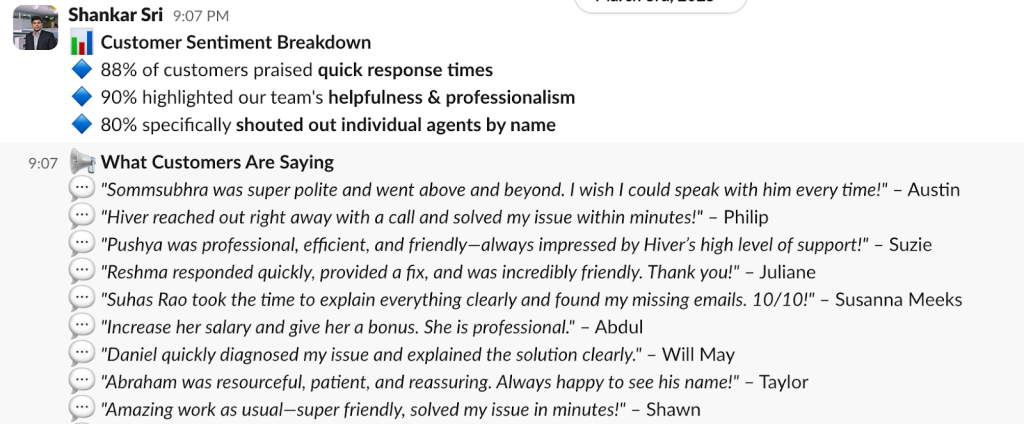
Hiver’s support team consistently hits 90%+ CSAT. When customers leave reviews, 80% name the agent specifically,” That’s what happens when agents have full context, no tab-switching, and actually have time to deliver quality, human service.
See how Hiver’s live chat software can help you do the same →
Formula:
CSAT (%) = (Number of positive ratings ÷ Total ratings received) × 100
How to improve CSAT:
- Send CSAT surveys immediately after the chat is closed so the experience is fresh
- Follow up with customers who have rated the experience lower than 3/5 to understand what went wrong
- Use AI to catch dissatisfied customers mid-conversation, before the score drops. Zendesk, for instance, has an AI coaching feature that analyzes conversations in real time and surfaces suggestions to agents as the chat unfolds — flagging when a tone is off, prompting a better response option, or alerting a supervisor when a conversation is going sideways.
7. Net Promoter Score (NPS)
NPS measures the likelihood that customers would recommend your business to their friends and family, measured on a 0–10 scale and expressed as a score from -100 to +100.
Why it matters: NPS measures loyalty, not just satisfaction. A customer who gives a ⅘ CSAT might still not recommend you. NPS captures whether your support is creating advocates or quietly eroding trust. Digital experience quality, including chatbot UX and response speed, directly impacts NPS.
Benchmark: Above 50 is excellent; 30–50 is good; 0–30 is average. Technology and SaaS companies typically benchmark between 40–60.
Hiver’s own NPS currently sits at 34.4 — squarely in the “good” range and consistent with our historical trend. It’s a number we’re actively working to push higher.
Formula:
NPS = % of Promoters (score 9–10) − % of Detractors (score 0–6)
How to improve NPS:
- Survey customers quarterly, not after every interaction, for a considered read on loyalty. NPS measures cumulative brand sentiment — not a single chat — so a periodic pulse check gives you a far more accurate signal than post-conversation triggers.
- Act on detractor responses within 48 hours to recover the relationship.
- Use AI to surface customer context automatically before the agent says a word. When a customer starts a chat, AI can pull their account tier, product usage, past tickets, and recent interactions, and present it to the agent in real time. This means agents skip the “let me look that up” phase entirely and open with responses that are already relevant to that specific customer’s situation.
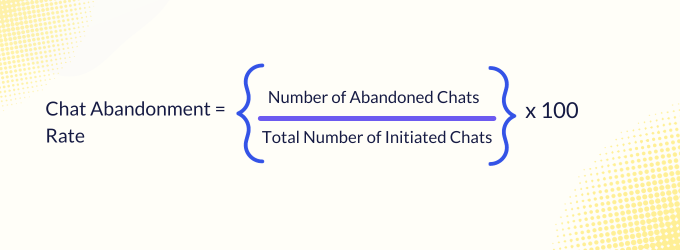
8. Chat Abandonment Rate
Chat abandonment Rate is the percentage of customers who left the chat queue or conversation before connecting with an agent or reaching a resolution.
Why it matters: Every abandoned chat is a failed support moment. High abandonment usually points to one culprit: wait time. If customers are leaving before saying anything, your queue isn’t moving fast enough.
Benchmark: Below 5% is the target for well-staffed teams. Industry average varies by sector — SaaS B2B typically sees 15–25%, while in e-commerce, this number can climb to 30–45%.
Formula:
Chat Abandonment Rate (%) = (Abandoned chats ÷ Total initiated chats) × 100
How to reduce Chat Abandonment Rate:
- Show estimated wait times proactively in the chat widget so customers know what to expect.
- Deploy an AI chatbot to handle the queue during peak hours.
- Limit operating hours to when you’re truly staffed, rather than offering chat you can’t cover.
9. Chat Handling Time
Chat Handling Time is the total time an agent spends actively managing a chat — from the first message to closing the conversation, including any post-chat activity like updating your CRM.
Why it matters: Chat Handling Time tells you how efficiently your team is moving through conversations, but it only makes sense in context. A low number could mean agents are resolving issues quickly, or it could mean they’re closing chats before the problem is actually solved. Always read it alongside Average Resolution Time and CSAT, and segment by query type. A billing dispute and a password reset, for instance, shouldn’t share the same benchmarks it could create misleading averages and unfair agent targets.
Benchmark: 6–8 minutes is considered healthy for most live chat operations. Contact center benchmarks typically cite 10–15 minutes as acceptable depending on complexity.
Formula:
Chat Handling Time = Total time across all chat sessions ÷ Number of chats handled
How to improve Chat Handling Time:
- Train agents to ask precise, diagnostic questions early rather than running through generic scripts.
- Provide canned responses and templated flows for the most common issue types. For example, for a “I can’t log in” query, the flow might look like: canned greeting → pre-written troubleshooting steps for the three most common login errors → a one-click escalation template if none of them work.
- Review long-handling-time chats to identify where conversations stall.
10. Concurrent Chats per Agent
Concurrent chats per agent are the number of simultaneous chat conversations an agent manages at one time.
Why it matters: Concurrency is where the agent productivity either scales or breaks. Unlike phone support, where an agent handles one call at a time, chat allows agents to manage multiple conversations simultaneously. But over-concurrency degrades response quality and leads to agent burnout. Getting this number right is a staffing and quality decision in one.
Benchmark: New agents: 1 chat at a time; experienced agents: 2–3 simultaneously; top performers: up to 4. Industry standards typically range from 2–6, depending on complexity.
Formula:
Concurrent Chats = Total active chat sessions at a given moment ÷ Number of agents currently handling chats
How to improve concurrent chats per agent:
- Cap concurrency limits in your routing logic based on agent experience level. For example, say your team has three agents — Rob, Sarah, and Harrison. You can configure a rule that blocks any new chat assignment the moment any one of them is already handling 3 live conversations. Rob, who’s newer, might be capped at 2; Sarah and Harrison, your senior agents, at 3–4.
- Use AI to handle tier-1 queries, so agents focus on conversations that actually need human judgment.
- Track CSAT alongside concurrency to catch when higher load is hurting quality. You might find that Harrison is handling 5 concurrent chats on average and consistently scoring the lowest CSAT on the team — not because he’s a poor agent, but because he’s stretched too thin to give each conversation the attention it needs.
Recommended reading
Live Chat Best Practices: 18 Proven Ways to Boost CSAT and Conversions in 2026
11. Agent Utilization Rate
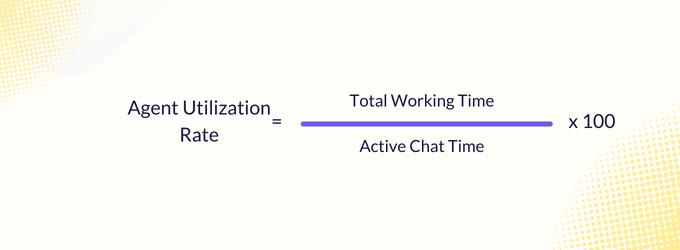
Agent utilization rate is the percentage of an agent’s logged-in working time actually spent handling live chat conversations.
Why it matters: Utilization rate is a staffing efficiency signal. Too low (under 60%) means you’re paying for idle time or have more agents than needed for current volume. Too high (above 85%) means your team is stretched, which directly impacts quality, burn rate, and eventually retention.
Benchmark: Call center benchmarks cite 75–85% as the general target for productive teams.
Formula:
Agent Utilization Rate (%) = (Active chat time ÷ Total working time) × 100
How to improve Agent Utilization Rate:
- Set utilization benchmarks by role and enforce them in scheduling.
- Balance workloads through even chat distribution, not just FIFO routing. A faster agent ends up handling significantly more chats than a slower one simply because they’re clearing their queue quicker. Round-robin routing solves this by distributing chats evenly across all available agents in a fixed rotation. For example, if Rob, Sarah, and Harrison are all online, the first chat goes to Rob, the second to Sarah, the third to Harrison, and the cycle repeats — regardless of who finished their last chat first. The result is a more predictable workload per agent and fewer situations where one person is overwhelmed while another is idle.
- Use volume forecasting to align staffing to expected demand curves.
12. Tickets per Agent
Tickets per agent refers to the total number of chats or support tickets each agent handles over a defined period — daily, weekly, or monthly.
Why it matters: This metric tells you individual agent output and gives you a workload baseline for capacity planning. Significant deviations from team averages in either direction are worth investigating. A high count with low CSAT often means an agent is rushing. A low count with high CSAT might signal inefficiency or over-complexity in that agent’s chat mix.
Benchmark: According to a study of 1000 operators done by Tidio, a general guideline is 30–50 chats per agent per day, with an average of about 29. Individual performance varies significantly by complexity and product.
Formula:
Tickets per Agent = Total chats (or tickets) handled ÷ Number of agents
How to improve Tickets Per Agent:
- Cross-reference tickets per agent with CSAT and FCR to assess quality alongside volume.
- Use AI to deflect repetitive queries, so agents spend time on conversations requiring real judgment.
- Review routing logic to ensure chats aren’t clustering on specific agents unfairly.
13. Chat Volume
Chat volume is the total number of live chat conversations initiated during a defined time period — hourly, daily, weekly, or monthly.
Why it matters: Chat volume is your foundation metric. It tells you how much demand you’re carrying, helps you predict staffing needs, and surfaces trends in customer engagement. An unexpected volume spike without corresponding staffing is how response times collapse. Volume trends over time also reflect live chat adoption, seasonal patterns, and the impact of product changes or marketing campaigns.
Benchmark: There’s no universal target. Volume is business-specific.
Formula:
Chat Volume = Total number of chat conversations initiated in a given period
How to improve chat volume:
- Map peak chat windows and staff accordingly. For example, if your team handles around 30 chats on a typical day but historical data shows volumes jumping to 100–150 chats during the holiday season, schedule additional agents or extend shift coverage in advance for those windows rather than scrambling reactively when the queue backs up.
- Deploy proactive chat triggers during high-intent website moments to capture volume strategically. For example, when a visitor has spent more than 30 seconds on your pricing page, you can pop up simple message like “Hi! Have any questions about our plans? Happy to help.”
- Identify volume patterns driven by product issues, so engineering can reduce avoidable contacts
14. Missed Chats
Missed chats are the number of chat conversations initiated by customers that went unanswered — either because no agent was available or the customer left before being picked up.
Why it matters: A missed chat is a missed opportunity for support, for sales, for retention. Each one represents a customer who tried to reach you and couldn’t. Beyond the immediate loss, high missed chat rates damage perception and can push customers to competitors. Staffing coverage and queue logic are the primary levers here.
Benchmark: Aim to keep missed chats below 5% of total chat volume. Larger teams with proper AI automation investment significantly outperform smaller teams on this metric.
Formula:
Missed Chat Rate (%) = (Missed chats ÷ Total initiated chats) × 100
How to avoid missed chats:
- Offer chat only during hours you’re genuinely staffed — narrow coverage beats false availability.
- Use chatbots as a fallback to capture customer intent even when agents are unavailable. When no agents are online, a chatbot can step in to greet the customer, ask what they need help with, and collect the relevant details like account information, issue description, preferred contact method. The customer gets an acknowledgment instead of silence, and your team wakes up to a structured queue of overnight requests rather than a blank missed chat log. You can then follow up via email once the team logs back in, with full context already captured.
- Implement missed chat notifications so agents can follow up proactively via email.
15. Reopened Chats
Reopened chat measures the percentage of of chats that were resolved but had to be reopened because the customer reached out again with the same issue. This is an indicator that the first resolution didn’t fully solve the problem.
Why it matters: Reopened chats are the canary for resolution quality. If customers are coming back for the same issue, something in your first interaction fell short — whether it’s agent knowledge, tool access, or the complexity of the problem. High reopened chat rates directly pull down FCR and inflate overall chat volume.
Benchmark: Under 5% is a healthy target. Any rate above 10% warrants a review of resolution processes and training.
Formula:
Reopened Chat Rate (%) = (Chats reopened ÷ Total resolved chats) × 100
How to reduce reopened chats:
- Before closing a chat, train agents to confirm the resolution explicitly: “Is there anything else I can help you with?”
- Tag reopened chats by issue type to identify which problems are systematically under-resolved.
- Feed reopened chat data back into your knowledge base to plug documentation gaps. For example, if agents are consistently missing a step when explaining how to update payment methods, write a dedicated article that walks through every edge case and link it directly in the chat tool so it surfaces automatically the next time a billing query comes in.
Recommended reading
Benchmarks Data For Live Chat Metrics
Use this table as a starting point. Adjust benchmarks to your industry and chat complexity.
| Metric | Benchmark |
|---|---|
| First Response Time | Under 30 sec (top); under 2 min (avg) |
| Average Response Time | Under 37 sec (industry avg) |
| Average Wait Time | Under 1 min (excellent); under 3 min (acceptable) |
| Average Resolution Time | Under 10 min (simple); under 1 hr (complex) |
| First Contact Resolution (FCR) | 70–75% (standard); 80–85% (excellent) |
| CSAT Score | 75–85% (good); 80%+ (excellent) |
| Net Promoter Score (NPS) | 30–50 (good); 50+ (excellent) |
| Chat Abandonment Rate | Below 5% |
| Chat Handling Time | 6–8 minutes |
| Concurrent Chats per Agent | 2–3 (experienced agents) |
| Agent Utilization Rate | 60–70% (sustainable); 75–85% (target) |
| Tickets per Agent per Day | 30–50 chats/day |
| Missed Chat Rate | Below 5% |
| Reopened Chat Rate | Below 5–10% |
How to Set Up Your Live Chat Metrics Dashboard
A metrics dashboard only works if it’s built around decisions, not just data. Here’s how to set one up that actually gets used:
Start with 5 core metrics
Trying to monitor all 15 at once creates noise. Begin with FRT, CSAT, FCR, Chat Volume, and Missed Chats. These five cover speed, quality, and coverage — the operational essentials. A
Avoid dashboard overload
A dashboard with 30 metrics is a dashboard nobody reads. Every metric on your screen should answer a specific operational question. If you can’t articulate what decision a metric informs, pull it out.
Align metrics to goals
If your greatest customer service goal for the quarter is reducing support costs, track agent utilization and tickets per agent. If it’s growing revenue, lead generation rate and chat-to-conversion rate belong at the top. Metrics should shift with business priorities.
Track trends, not snapshots
A single day’s CSAT score means almost nothing. A three-month trendline tells you whether you’re improving or regressing. Build your dashboard to surface week-over-week and month-over-month movement.
Use automation and AI insights
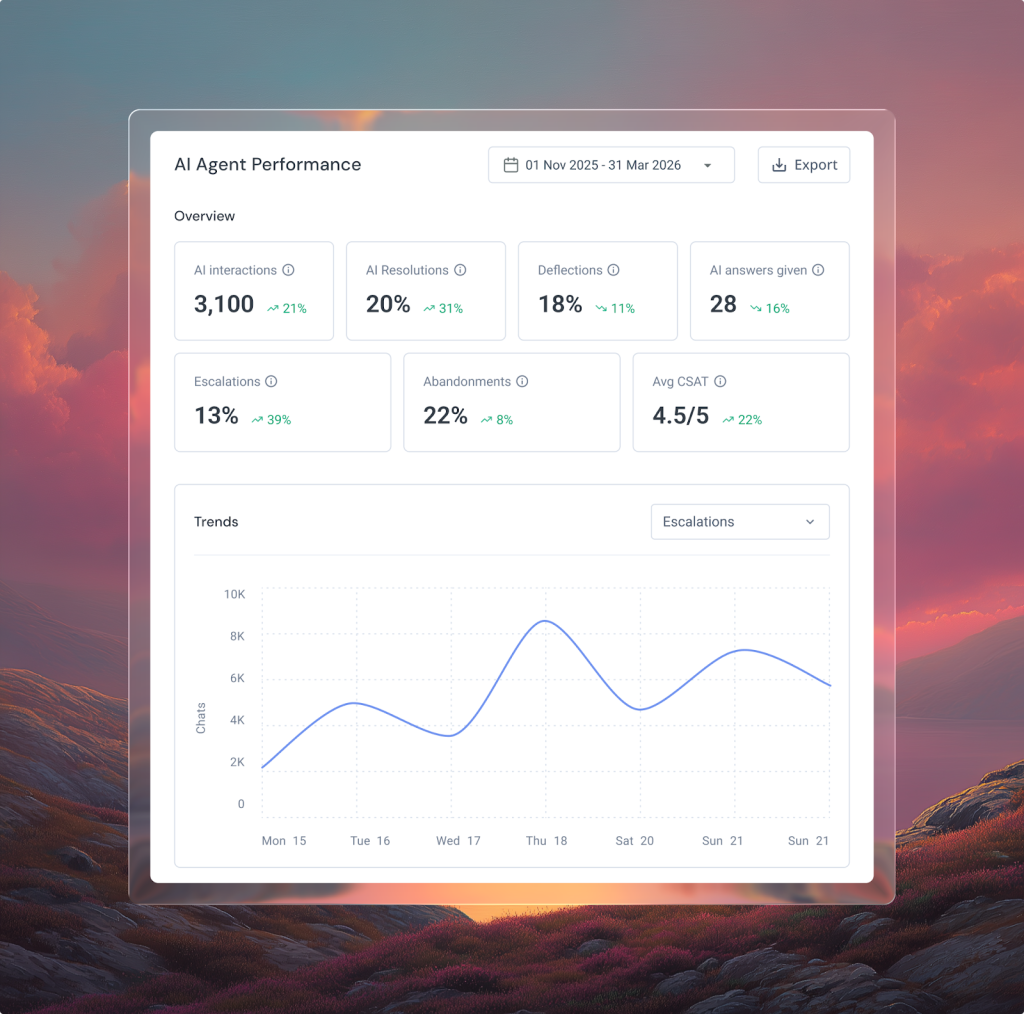
Tools like Hiver provide real-time visibility into response times, chat volume, resolution rates, and CSAT, along with dedicated Analytics for AI Agents view, so you can see how many conversations your AI is handling, how often it’s resolving issues autonomously, and when it’s handing off to humans. You can track AI interactions, AI resolutions, deflections, AI answers given, escalations, abandonment rate, and average CSAT — all in one place. When your platform surfaces these insights automatically, you spend less time building reports and more time acting on them.
Common Challenges in Tracking Live Chat Metrics
Most teams aren’t short on live chat data; they’re stuck figuring out why all that data isn’t improving performance. Here’s where things usually go wrong:
Tracking Too Many Metrics
Teams pull every available data point and end up with reports nobody acts on. More metrics doesn’t mean more clarity.
Start by choosing 5–8 metrics tied to specific business outcomes. Revisit and prune them quarterly.
Over-Focusing on Speed
FRT and response time are the easiest metrics to understand, so they become the only ones optimized for — often at the expense of resolution quality. A 10-second response that doesn’t solve anything is worse than a 2-minute response that does.
That’s why, always pair speed metrics with quality metrics (FCR, CSAT, NPS, Reopened Chats). Speed is the table stakes; quality is the differentiator.
Data Living in Silos
Oftentimes chat data sits in one platform, CRM data in another, and sales conversion data in a third. Nobody connects the dots, so revenue impact stays invisible.
It’s therefore essential to integrate yourlive chat platform with your CRM and analytics stack. Use tools that track both agent performance and business outcomes in a unified workspace.
Not Acting on Insights
The metrics are there, the dashboard is built, but if nobody changes anything, there’s no point to all the tracking. Data without decision-making is just overhead.
Create a weekly review ritual — 30 minutes, five metrics, one action item. Metrics drive change when they’re reviewed in a context where someone has the authority and responsibility to act.
The Live Chat Metric That Matters Most? The One You Act On
Tracking 15 metrics sounds like a lot. It doesn’t have to be. Start with five, know what each one is telling you and then change something based on what you see.
The teams that consistently outperform on CSAT, FCR, and conversion aren’t measuring more — they’re measuring with intent. They know that a 10-second average response time is meaningless if the conversation goes nowhere, and that a high chat volume is only good news if the team can handle it without burning out.
Live chat is one of the few channels where speed, quality, and revenue impact are all measurable in real time. Most teams use it to react, but the best ones use it to get ahead.
Frequently Asked Questions
1. How do you measure the effectiveness of live chat?
Measure live chat effectiveness across three dimensions: speed (FRT, Average Wait Time), quality (CSAT, FCR, Reopened Chats), and business impact (Chat-to-Conversion Rate, upselling and cross-selling opps, Revenue per Chat). No single metric tells the full story.
2. What are the key live chat metrics to track?
There are five non-negotiable live chat metrics: First Response Time, CSAT, First Contact Resolution Rate, Chat Volume, and Missed Chats. These cover the core dimensions of speed, quality, and coverage.
3. What is a good first response time for live chat?faction (CSAT) in live chat?
Under 30 seconds for top-performing teams. Under 2 minutes is the industry average. Anything above 5 minutes correlates with significant abandonment. With AI handling routine first touches, sub-5-second FRT is now achievable for most query types.
4. What is the difference between First Response Time and Average Resolution Time?
FRT measures how quickly an agent acknowledges the customer. Average Resolution Time measures how long it takes to fully solve the problem. An agent can have excellent FRT and poor resolution time. Both matter, but they measure different things.
5. How does AI affect live chat metrics?
Significantly. AI chatbots successfully resolve 87% of customer inquiries without human intervention in well-configured deployments. This reduces wait times by up to 37.5% for large teams, and allows human agents to focus on complex conversations. Monitoring AI-specific metrics like handoff rate, AI containment rate, and AI-resolved FCR is becoming standard practice in 2026.
6. How many live chats should an agent handle per day?
According to Tidio, the benchmark is 30–50 chats per day, with an average of around 29 based on real operator data. The exact number, however, depends on complexity and handling time. An agent handling 60 simple FAQ chats is very different from one managing 20 complex technical issues. Always contextualize volume with CSAT and FCR.
7. What tools can track live chat metrics?
Platforms like Hiver provide built-in analytics for tracking chat volume, response times, resolution rates, CSAT, and AI handoff patterns — without requiring complex setup. Its analytics dashboard surfaces real-time performance data alongside AI-powered quality scoring and sentiment trends. It allows teams to connect operational metrics to customer experience outcomes in a single workspace.