Skip to content


SolarWinds has long been a go-to for IT monitoring, but a lot of users say it’s become more work than help. Setup takes too long, pricing isn’t always clear, and the interface feels dated.
If you’re spending more time managing the tool than your systems, it might be time to switch. Here’s a look at the top SolarWinds competitors in 2025, which offer faster setup, transparent pricing, and simpler monitoring.
Table of Contents
- What is SolarWinds?
- Why Trust our Software Reviews?
- Top SolarWinds Alternatives in 2025
- 2. Datadog
- 3. New Relic
- 4. Dynatrace
- 5. ManageEngine OpManager
- 6. Zabbix
- 7. Site24x7
- 8. LogicMonitor
- 9. Prometheus
- 10. Auvik
What is SolarWinds?
SolarWinds is an IT monitoring and management platform that helps organizations track the performance of their networks, servers, databases, and applications. It gives IT teams real-time visibility into uptime, bandwidth, and system health. With this, the teams can quickly detect and fix issues before they cause downtime.
The platform includes modules for network monitoring, application performance tracking, database optimization, and IT service management, making it a comprehensive tool for managing both on-premise and hybrid infrastructures.
Why Trust our Software Reviews?
We didn’t rely on vendor marketing pages for this comparison. Each tool here was evaluated based on its performance in real-world environments.
Each product on this list was evaluated based on:
- How fast it is to deploy.
- How much ongoing maintenance it requires.
- How licensing scales when your environment grows.
- What real admins say in G2, Capterra, and Reddit threads
Disclaimer: This isn’t a “best tools” roundup. It’s a shortlist of tools teams actually enjoy working with.
Top SolarWinds Alternatives in 2025
Once you identify the gaps in SolarWinds, the next step is to find a tool that actually fits your setup.
Here’s a quick look at the top SolarWinds competitor in 2025, what they’re best for, how they’re priced, and whether you can try them for free.
| Tool | Best For | Pricing | Free Plan / Trial |
|---|---|---|---|
| Hiver | Teams that manage IT or internal support via email; built for fast ticketing, SLA tracking, and automation from an inbox-like interface | Starts at $25/user/month | Has a free plan |
| Datadog | Cloud-native monitoring and full-stack observability (logs, metrics, traces) | Usage-based; typically $15–$20 per host/month | Has a free plan |
| New Relic | Application performance and infrastructure monitoring with unified telemetry | Usage-based; free up to 100 GB/month, then pay-as-you-go | Has a free plan |
| Dynatrace | Enterprise-grade AI observability with automated discovery and root cause analysis | Custom quote; starts around $21 per 8 GB host/month | 15 days free trial |
| ManageEngine OpManager | Hybrid network devices and server monitoring for SMBs and on-prem setups | Starts at $245 for 10 devices (perpetual license) | Has a free plan |
| PRTG Network Monitor | Simple network monitoring for small to mid-size IT teams | Starts at $2,149 for 500 sensors | Has a free plan |
| Site24x7 | Cloud and web app monitoring with real-user experience tracking | Starts at $9/month | 30 days free trial |
| LogicMonitor | Unified monitoring for hybrid infrastructure (SaaS + on-prem) | Custom pricing (quote-based) | 14-day free trial |
| Prometheus | Open-source metrics collection and alerting | Free (self-hosted) | Has a free plan |
| Grafana | Visualization and dashboards for observability stacks | Free (open-source); paid cloud from $8/user/month | Has a free plan |
Each of these SolarWinds competitor fits a different kind of team. Let’s look at these tools one by one.
1. Hiver
Hiver is a modern AI customer service platform that unifies support channels like email, chat, voice, WhatsApp, and more into one intuitive interface. It’s ideal for IT, finance, or internal service teams that deal with high request volumes and need visibility, automation, and accountability.
With Hiver, teams can automate routine tasks, collaborate on issues, and get real-time insights into performance.
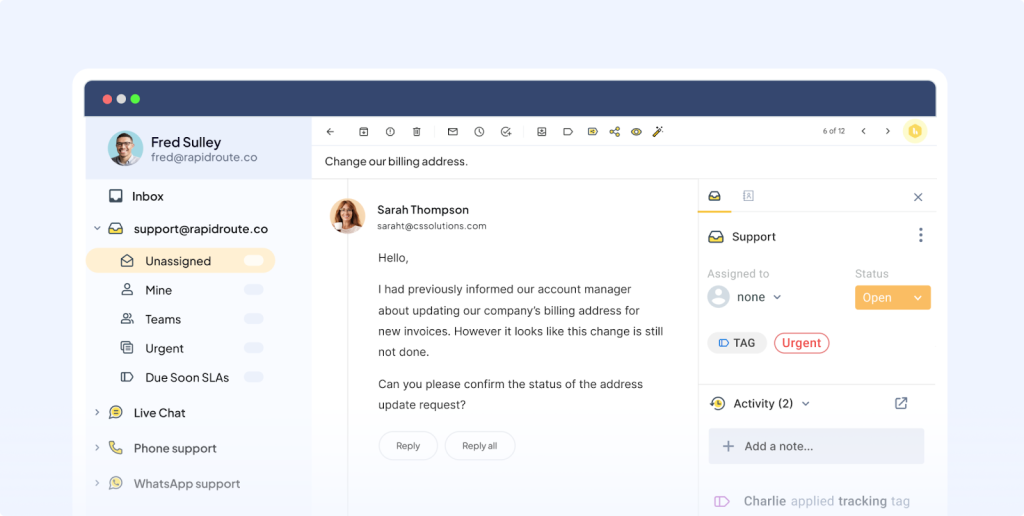
Instead of endless setup, Hiver provides instant structure with a single place to manage all requests, assign ownership, and automate follow-ups.
Best for
IT, finance, or internal service teams that handle requests via email or chat and want structure, visibility, and automation without moving to a heavy ITSM system.
Key features
- AI capabilities: Automate repetitive Tier-1 queries, summarize long conversations, suggest better responses, and flag SLA risks automatically.
- Automation: Build rules to assign tickets, escalate issues, and trigger alerts based on workload or keywords.
- Integrations: Connects with Slack, Asana, Salesforce, and other tools your team already uses.
- Collaboration: Leave notes, tag teammates, and share context instantly to speed up responses.
- 24/7 support: Dedicated onboarding and global support across all plans.
Pros
- A clean, easy-to-navigate, and familiar interface that teams actually use.
- Built-in AI reduces manual work and response time.
- “Hiver is easy to navigate and allows customers to always be taken care of! I never worry if our team has forgotten an email or not. I use Hiver every day and it allows us to stay organized.” – Shannah P., G2 user
- “Hiver makes our roles so much easier and keeps our busy inbox manageable. We always know where we are up to.” – Abbey B., G2 user
Cons
- Limited mobile app features, which restrict effective usage on the go.
- Limited ITSM integrations.
- “I also would like to see Hivers smartphone app allow the creation and editing of tags, not just the ability to tag” – Verified User, G2 user
- “Data sharing could be more robust and flexible. Integration with external systems sometimes requires extra effort or custom solutions.” – Christian G., Capterra user
All reviews are sourced from G2, Reddit, and Capterra.
Pricing
Hiver offers a free plan with shared inbox and chat management. Paid plans start at $25/user/month, adding advanced automation, SLA tracking, and AI insights.
Why Hiver is a better alternative to SolarWinds?
SolarWinds tracks infrastructure. Hiver manages people and processes by helping IT and internal teams handle requests, automate responses, and stay on top of workloads. It delivers structure and visibility like a help desk, but without the complexity or heavy admin work.
2. Datadog
Datadog is a cloud-native monitoring platform that gives teams complete visibility across infrastructure, applications, logs, and security in one dashboard.
It works by collecting data from servers, containers, and APIs, then correlating it to show where issues start and how they spread. With over 600 integrations, Datadog connects seamlessly with AWS, Azure, GCP, and Kubernetes.
Best for
DevOps and IT teams running applications across AWS, Azure, or GCP who require continuous observability, rather than just uptime monitoring.
Key features
- All-in-one monitoring: Instead of switching between tools for servers, apps, and databases, Datadog shows everything in one place, so you see problems the moment they start.
- Smart alerting: AI automatically spots unusual spikes or slowdowns and flags them before users are affected.
- Live dashboards: Track uptime, performance, and errors in real time with drag-and-drop visualizations.
- Code-level tracing: Pinpoint exactly where an application slows down, down to the specific line of code.
Pros
- Great visibility across apps, servers, and networks.
- Integrates deeply with cloud and DevOps tools.
- “Datadog provides real-time visibility into infrastructure and application performance with intuitive dashboards and robust alerting. I love how easy it is to set up monitors and correlate metrics, logs, and traces all in one place.” – Akshay A., G2 user
- “We have deployed Datadog for our all cloud deployments in AWS cloud. A large number of integrations allow us to literally monitor everything.” – Nabeel S. G2 user
Cons
- Costs rise quickly as you monitor more systems.
- The interface can feel busy for small teams.
- “It’s really expensive, sometimes configuring a dashboard or specific monitors is really hard as the platform is too big, which feels overwhelming…” – Cesar Daniel Z., G2 user.
- “User interface contains an overwhelming amount of features that make it difficult to navigate through…” – Aviv Y., G2 user.
All reviews are sourced from G2, Reddit, and Capterra.
Pricing
Starts at $15 per host/month for infrastructure monitoring. APM, logs, and security modules are billed separately. A 14-day free trial is available.
Why Datadog is a better alternative to SolarWinds
SolarWinds is great at monitoring static infrastructure but struggles with cloud complexity. Datadog does the opposite. It automatically discovers new assets, correlates data across systems, and scales without the manual setup SolarWinds demands.
If your environment changes often or if you need to track everything from a single window, Datadog is the smarter choice.
3. New Relic
New Relic is a cloud-based observability platform that helps teams monitor the performance of their applications, servers, and infrastructure in real time. It brings all your logs, metrics, and traces together so you can pinpoint performance issues before they impact users.
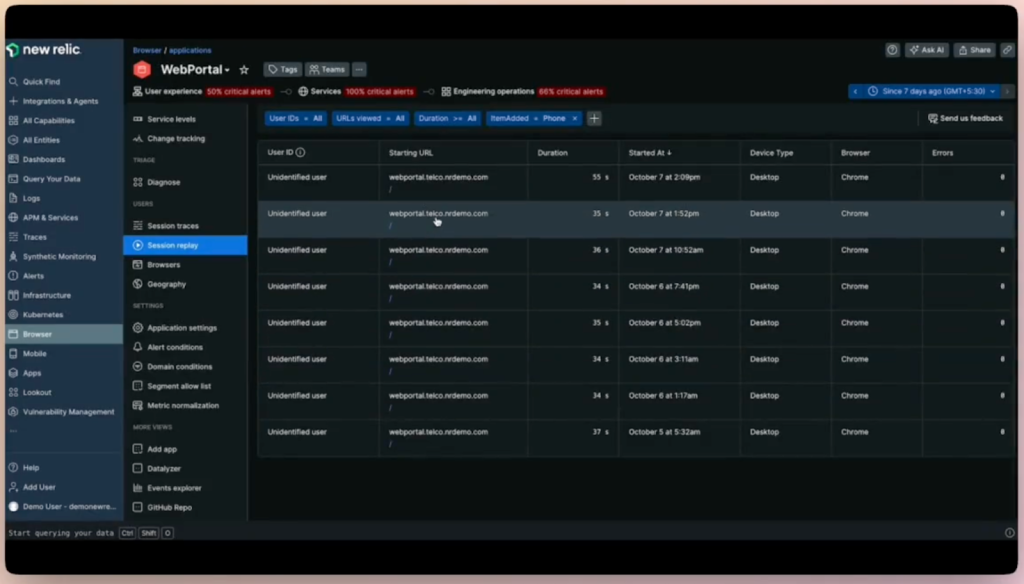
Unlike SolarWinds, which focuses heavily on traditional network monitoring, New Relic gives you a full picture from backend systems to the user experience.
Best for
Engineering and DevOps teams running modern, cloud-native applications that need continuous visibility into performance, uptime, and user experience.
Key features
- Full-stack monitoring: View application, infrastructure, and end-user performance in one dashboard.
- Code-level tracing: Identify slow transactions or API calls down to the exact line of code.
- Real-user monitoring (RUM): Measure how users experience your app in real time.
- Error and log management: Automatically group and prioritize issues to find the root cause faster.
- AI-based alerts: Detect unusual spikes or performance drops before they turn into outages.
Pros
- Excellent ease of use, with intuitive design and accessible features for quick setup.
- Real-time monitoring delivers fast insight and helps engineers catch issues early.
- “The UI is clean, dashboards are customizable, and setting up alerts is super easy — it catches issues before they escalate.” – Viren L., G2 user
- “Delivering real time performance insights across the entire stack is where new relic shines.” – Abhinav N., G2 user.
Cons
- Seen as expensive, especially as data volume and user count rise.
- Initial setup can be complex, leading to a steeper learning curve than simpler tools.
- “Too costly. Compared with other platforms which provide almost similar features, New Relic price is very high.” – Verified User, G2 user
- “Learning curve felt like bit steep for new comers, pricing structure was complicated and a little more on expensive side.” – Hardik P., G2 user
All reviews are sourced from G2, Reddit, and Capterra.
Pricing
You get 100 GB of data and one full-user for free. Paid plans start at $49 per full-user/month, with costs scaling by data ingestion and additional seats.
Why New Relic is a better alternative to SolarWinds
SolarWinds gives you infrastructure metrics; however, New Relic gives you real-time observability. It connects logs, traces, and user sessions across your stack, making root-cause analysis faster and more accurate.
New Relic is a more flexible, future-ready solution for teams managing complex, cloud-based systems.
4. Dynatrace
Dynatrace is a software intelligence platform built for organizations that run large, distributed systems. It automatically discovers every component of your infrastructure from servers and containers to user sessions. It then uses AI to pinpoint problems before they impact customers.

Unlike SolarWinds, which still relies heavily on manual configuration, Dynatrace delivers end-to-end observability out of the box, powered by its AI engine, Davis.
Best for
Enterprises and IT teams managing complex, hybrid, or multi-cloud environments that need automated, real-time visibility without heavy manual setup.
Key features
- Automatic discovery: Automatically identifies and visualizes all applications, services, and connections.
- Davis AI engine: Analyzes millions of data points to detect the root cause of incidents instantly.
- Full-stack visibility: Covers infrastructure, applications, security, and user experience in one dashboard.
- Synthetic and real-user monitoring: Simulates user journeys and monitors real interactions for performance issues.
- Cloud integrations: Works seamlessly with AWS, Azure, GCP, VMware, and Kubernetes.
Pros
- End-to-end visibility across apps, infrastructure, and user-experience monitoring.
- Good cloud-native integrations and support for modern stacks.
- “…This, coupled with deep insights into application security, log insights, and code level debugging, make for a powerful cocktail in the observability space.” – Sean O., G2 user.
- “…It offers great support for cloud native applications such as AWS, Azure and GCP cloud…” – Vivek Y., G2 user.
Cons
- Pricing can be high, and the licensing/consumption model is often confusing and unpredictable.
- Steep learning curve for new users or smaller teams, feature-rich but complex.
- “…The only downside is that Dynatrace’s pricing can be a bit on the higher side, especially for smaller teams or businesses just getting started.” – Karan S., G2 user
- “…Dynatrace has a big learning curve. Most things are user-friendly, but they require a lot of reading to get used to. Also, at times, the customer support at tickets is a bit too slow…” – Karolos G., G2 user
All reviews are sourced from G2, Reddit, and Capterra.
Pricing
Dynatrace uses a usage-based pricing model that scales with your environment size. Infrastructure monitoring starts at around $0.04 per hour per host, while full-stack monitoring is about $0.08 per hour for an 8 GiB host (roughly $69 per month).
The platform also offers a flexible Platform Subscription plan, giving teams full access to all features under a single usage-based model with no hidden fees.
Why Dynatrace is a better alternative to SolarWinds
SolarWinds requires extensive setup and manual correlation between systems. Dynatrace automates all of it, like discovery, dependency mapping, and root-cause detection using AI.
For enterprises with fast-changing, distributed systems, Dynatrace offers smarter automation, faster detection, and fewer false alerts than SolarWinds ever could.
5. ManageEngine OpManager
ManageEngine OpManager is a network monitoring and IT operations platform that gives mid-size IT teams complete visibility into their servers, routers, firewalls, and virtual machines.
It’s one of the most practical SolarWinds alternatives for organizations that still prefer on-prem monitoring but want something easier to deploy and manage.
Best for
IT teams in mid-sized businesses that need real-time network and server monitoring without the steep setup or licensing complexity of SolarWinds.
Key features
- Multi-device monitoring: Track routers, switches, servers, and virtual machines in real time.
- Custom dashboards: Build role-based views for network admins, server engineers, and managers.
- Threshold-based alerts: Get notified automatically when critical metrics cross limits.
- Network maps: Visualize device dependencies and traffic flows with drag-and-drop mapping.
- Integrations: Works with ServiceDesk Plus, Jira, and other ITSM tools.
Pros
- Easy on-prem deployment with minimal configuration.
- Clear, customizable dashboards.
- “OpManager is one of the best tools for monitoring the IT infrastructure. Easy to install and integrate with almost every OEM…” – Rajiv T., G2 user.
- “…It provides unified, real-time monitoring for devices, servers, hypervisors (VMware, Hyper-V), firewalls, and more—all visualized through customizable dashboards and network maps that simplify root‑cause analysis…” – Jeevesh T., G2 user.
Cons
- Limited or missing features in notifications and settings.
- Interface feels dated and less intuitive than modern SaaS tools.
- “Limited deep customization without scripts…” – Rajpalsinh R., G2 user
- “If I had to point out a drawback, I’d say the interface can sometimes feel a bit outdated and not very intuitive, especially if you’re working across many devices.” – Verified User, G2
All reviews are sourced from G2, Reddit, and Capterra.
Pricing
OpManager pricing starts at $95 for 10 devices with 2 users. Higher tiers are available for larger environments. A 30-day free trial is available.
Why ManageEngine is a better alternative to SolarWinds
SolarWinds can be too complex for mid-sized IT environments. OpManager delivers the essentials like performance tracking, alerting, and reporting, in a package that’s easier to maintain and far more affordable.
It’s ideal for teams that want dependable network visibility without the overhead of enterprise-grade monitoring.
6. Zabbix
Zabbix is a fully open-source monitoring platform that covers networks, servers, applications, and cloud services without licensing fees. It’s a strong SolarWinds alternative for teams that want full visibility and control minus the high costs or vendor restrictions.
Best for
IT teams and system administrators who want enterprise-level monitoring capabilities with open-source flexibility and no licensing costs.
Key features
- Comprehensive monitoring: Track availability, performance, and health across networks, VMs, databases, and applications.
- Flexible alerts: Set up custom triggers and escalation rules for different systems and priorities.
- Auto-discovery: Automatically detect and add new devices to your monitoring setup.
- Visualization tools: Build detailed maps, graphs, and dashboards tailored to your environment.
- Community plugins: Extend functionality with hundreds of free monitoring templates and integrations built by the user community.
Pros
- Completely free and open-source.
- Highly customizable with strong community support.
- …It is open source it is free which makes it a good tool to work with. We can customize the Dashboard and alerts as per our need using this tool… – Ayush S., G2 user
- “Its open-source nature allows for full customization, and the platform supports a wide range of devices and protocols, making it ideal for monitoring complex IT environments.” – Deusimar P., G2 user
Cons
- Steeper learning curve for non-technical users.
- Interface feels outdated compared to modern SaaS tools.
- “… While Zabbix is highly configurable, the initial setup can be quite complex and may require a steep learning curve for new users…” – Deusimar P., G2 user
- “The UI, while functional, feels outdated and not very intuitive for newcomers…” – Pradeep K., G2 user
All reviews are sourced from G2, Reddit, and Capterra.
Pricing
Zabbix is completely free and open-source.
Why Zabbix is a better alternative to SolarWinds
Zabbix offers the same core monitoring capabilities as SolarWinds but without the licensing headaches. It’s ideal for teams that prefer building their own systems rather than renting them. You’ll trade some ease of setup for full ownership, flexibility, and zero recurring costs.
7. Site24x7
Site24x7 is a cloud-based monitoring platform from Zoho that combines website, server, application, and network monitoring in one place. It’s a strong SolarWinds alternative for teams that want a single dashboard for both cloud and on-prem infrastructure.
Best for
IT and DevOps teams managing hybrid or multi-cloud environments who want end-to-end monitoring, performance visibility, and user experience tracking in a single tool.
Key features
- Full-stack monitoring: Covers servers, apps, networks, cloud resources, and websites.
- Synthetic monitoring: Simulate user transactions and test uptime from 120+ global locations.
- AI-powered insights: Detect anomalies and performance deviations automatically.
- Root cause analysis: Get actionable diagnostics across layers — from front-end to backend.
- Integrations: Works with AWS, Azure, GCP, Slack, Jira, and more.
Pros
- Broad monitoring coverage across cloud, network, and apps.
Easy to deploy, no hardware or manual configuration needed.
- “Site24x7 is a reliable and comprehensive monitoring tool for a wide range of scenarios—from website uptime and real-time performance checks to server and infrastructure monitoring…” – Amir E., G2 user
- “…The ease of deployment and the wide coverage (cloud, network, and website monitoring) make Site24x7 indispensable to ensure high availability and security.” – Bastien L., G2 user
Cons
- Complex pricing model and add-ons can increase costs quickly and unexpectedly.
- Advanced features are more limited.
- “Site24x7 is affordable, but it can quickly get pricey due the monitor “types”…” – Eric D., G2 user
- “…cloud cost optimization need more granular features for tracking specific resources for spending resources mindfully” – Shivani G., G2 user
All reviews are sourced from G2, Reddit, and Capterra.
Pricing
Site24x7 offers a range of plans starting at $9/month (paid annually). Their All-in-One plan begins at $42/month for one application, five servers, 20 websites, and 4 GB log storage.
Why Site24x7 is a better alternative to SolarWinds
Site24x7 delivers the same broad coverage as SolarWinds but through a simpler, fully cloud-based setup. You don’t need on-prem servers or complex installations, just connect and start monitoring.
For teams moving to cloud or hybrid environments, it’s a faster, lighter option with strong value for money.
8. LogicMonitor
LogicMonitor is a cloud-based infrastructure monitoring and observability platform that gives IT and DevOps teams real-time visibility across networks, servers, cloud services, and applications.
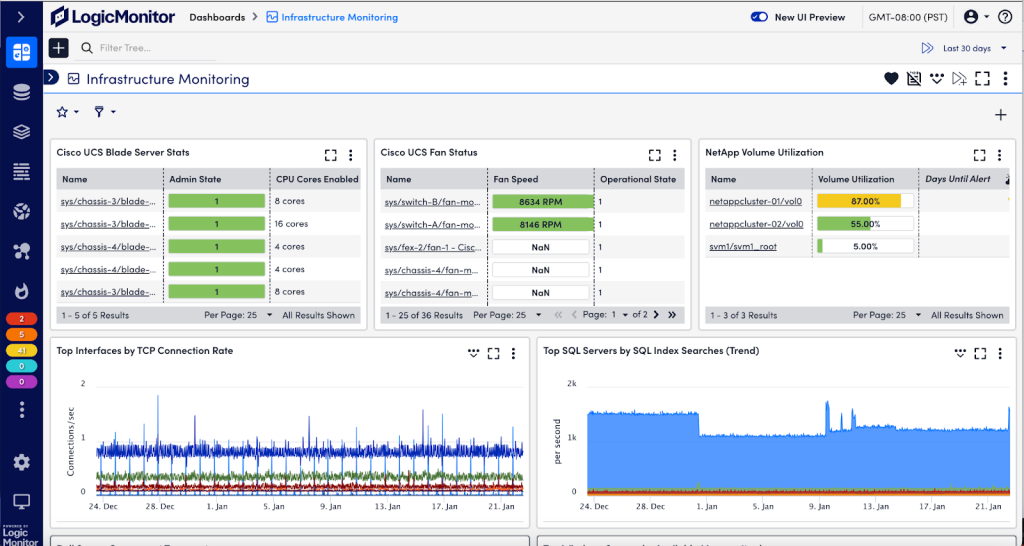
It’s one of the best SolarWinds alternatives for teams that need depth and automation without managing on-prem hardware or manual configurations.
Best for
Enterprises and growing IT teams that manage hybrid or multi-cloud environments and want AI-powered insights without the operational overhead of maintaining their own monitoring infrastructure.
Key features
- Automatic discovery: Instantly detects and maps new devices, containers, and cloud resources.
- AI-based anomaly detection: Identifies unusual trends and performance drops before they become outages.
- Custom dashboards: Create unified views for network, app, and infrastructure metrics.
- Prebuilt integrations: Supports 2,000+ integrations, including AWS, Azure, GCP, VMware, and Kubernetes.
- Role-based access: Manage monitoring and alerts by team or department.
Pros
- Excellent visualization and correlation between metrics.
- Works seamlessly across hybrid and multi-cloud setups.
- “Instead of telling your monitoring tool what you want monitored, LogicMonitor will discover a lot of the metric & data points for you, mostly out of the box and away you go…” – Laurie S., G2 user
- “Both the customer support and the availability of documentation on the LogicMonitor website make it really easy to integrate with many solutions such as Azure, AWS, M365 etc…” – Verified User., G2 user
Cons
- Some feature limitations are reported by the users.
- Alert customization requires some learning curve.
- “Update frequency of modules not always following the latest available versions of s systems/applications to be monitored. Some feature limitation (for example maximum 15 Log pipelines)” – Verified User., G2 user
- “It is complicated when trying to setup alerting. The UI to setup alert routing is not very user friendly.” – Frank C., G2 user.
All reviews are sourced from G2, Reddit, and Capterra.
Pricing
LogicMonitor uses a custom, usage-based pricing model depending on the number of monitored devices, metrics, and add-ons. While specific prices aren’t listed publicly, reviews suggest starting costs around $20–$25 per monitored device/month, with a 14-day free trial available.
Why LogicMonitor is a better alternative to SolarWinds
SolarWinds requires manual setup, hardware dependencies, and module-based pricing. LogicMonitor simplifies all of that. It’s fully cloud-hosted, automatically maps your entire environment, and uses AI to predict issues before they hit users.
For teams tired of constant maintenance, it’s a smarter, hands-off way to stay in control.
9. Prometheus
Prometheus is an open-source monitoring and alerting toolkit originally developed by SoundCloud. It’s built for dynamic, containerized environments, making it a go-to choice for teams running Kubernetes, Docker, or microservices at scale.
As a SolarWinds alternative, Prometheus offers flexibility, speed, and transparency for teams that prefer open-source control over commercial complexity.
Best for
DevOps and SRE teams managing cloud-native applications who want full control of their monitoring stack and are comfortable managing open-source tools.
Key features
- Time-series data collection: Efficiently stores and queries metrics using a powerful custom query language (PromQL).
- Kubernetes-native: Integrates seamlessly with containerized workloads for real-time service monitoring.
- Flexible alerting: Customizable alerts with routing through Alertmanager (Slack, email, PagerDuty, etc.).
- Pull-based model: Prometheus scrapes targets at intervals, ensuring data freshness and control.
- Extensible ecosystem: Works with Grafana, Loki, and other visualization and logging tools.
Pros
- Easy to integrate with most visualization tools.
- Highly feature-rich compared to other monitoring solutions.
- “…It’s highly efficient, easy to deploy, and integrates smoothly with popular tools like Grafana and Kubernetes” – Verified User., G2 user
- “…I haven’t found any other monitoring solution which is as feature rich as Prometheus…” – Ibrahim D., G2 user
Cons
- No native UI for deep visualization.
- Alerting setup can be complex for beginners.
- “…understand its query & visual presentation, without Graffna, would be hard to interpret the data…” – Dayalan T., G2 user.
- “THere are some manual things that can be better like the alerting features can be made easy…” – Hitesh M., G2 user
All reviews are sourced from G2, Reddit, and Capterra.
Pricing
Prometheus is 100% free and open-source, licensed under Apache 2.0. You can host and manage it yourself or use managed Prometheus services through platforms like Grafana Cloud or AWS Managed Service for Prometheus.
Why is Prometheus a better alternative to SolarWinds
SolarWinds locks features behind licenses; Prometheus gives you full control at zero cost. It’s faster, more flexible, and built for the containerized world SolarWinds struggles to support.
For DevOps teams with strong technical expertise, Prometheus offers the freedom to build exactly the monitoring stack they need.
10. Auvik
Auvik is a cloud-based network monitoring and management platform built to simplify complex network operations. It automatically discovers every device on your network, visualizes connections in real time, and alerts you to performance issues before they escalate.

For IT teams seeking a SolarWinds alternative that’s faster to deploy and easier to maintain, Auvik delivers the same visibility with far less effort.
Best for
IT teams and Managed Service Providers (MSPs) managing multi-site or client networks who need quick setup, automated mapping, and proactive alerting, without heavy on-prem dependencies.
Key features
- Automated network discovery: Scans and maps every connected device within minutes.
- Live topology visualization: View how all devices connect and communicate in real time.
- Configuration management: Automatically backs up device configurations and tracks every change.
- Traffic analysis: Identify bandwidth-heavy applications and troubleshoot slowdowns faster.
Pros
- Easy, fast setup; most users report full deployment in under an hour.
- Intuitive interface and real-time mapping that make troubleshooting simple.
“…ease to set up, configure with login and SNMP. notifications if devices goes down…” – Martin E., G2 user
“…Plus, the interface is clean and pretty intuitive, even for someone who’s not deep into networking every day…” – Kapil R., G2 user
Cons
- Network maps and device detection sometimes show inaccuracies or incomplete data, particularly with certain models.
- Users report alert fatigue and excessive notifications when alert logic isn’t finely tuned.
- “…The network maps are all over the place with connections that do not even physically exits…” – Jamie T., G2 user
- “Site goes under maintenance pretty frequently and creates a lot of false positive alerts.” – Verified User, G2 user
All reviews are sourced from G2, Reddit, and Capterra.
Pricing
Auvik uses a per-device pricing model, depending on scale and features. Pricing is customized for MSPs and enterprises, with a 14-day free trial available.
Why is Auvik a better alternative to SolarWinds
SolarWinds offers detailed visibility but demands manual setup, hardware, and ongoing maintenance. Auvik automates discovery, mapping, configuration tracking, and alerting through the cloud.
It’s ideal for teams that want strong network insight without being buried under setup, licensing, or maintenance work.
Why Look for SolarWinds Alternatives?
SolarWinds is powerful, but for many IT teams, it’s become more of a burden than a benefit. Here’s why they’re switching:
1. High licensing and add-on costs: Every feature, from alerting to automation, needs a separate module. Costs stack up fast, especially for smaller IT teams.
“Price point is higher compared to a few other available ticketing tool.” – N G., G2 user
2. Security concerns: The 2020 supply-chain breach made many teams rethink trust in on-prem vendors. Even after fixes, confidence hasn’t fully returned.
“Parent company says no to using any of their software. Moved to all open source monitoring software. I needed something now for monitoring and didn’t want to go wait for a procurement process…” – Reddit user.
3. Support failures and unresponsiveness: Tickets for critical issues often go unanswered or get rejected.
“Out of nowhere, SolarWinds HD started rejecting any new ticket requests for non-domain email addresses. This has caused literally thousands of support tickets to get rejected.” – says a Reddit user.
4. Paying for features you can’t use: Licensing bugs and restrictions make cost control a constant challenge.
“They have a bug preventing us from using a license we are paying for, which means we are down one key feature of the software.” – a Reddit user.
5. Complex setups that trap you: Heavy customization with scripts and regex alerts makes SolarWinds difficult to migrate away from.
“I’d like to move off SolarWinds, but some of the things we’ve set up on there seem like they’d be difficult to replicate. This includes: custom alert triggers with device variables … use regex to add readable log to body.” — a Reddit user.
6. Performance lags when it matters most: Monitoring delays and sluggish dashboards reduce real-time visibility.
“We had a SolarWinds implementation… but we are frustrated … critical devices & interfaces are being polled every 3 minutes, but everything else is being polled every 7 minutes.” — a Reddit user.
7. Overwhelming interface and slow workflows: SolarWinds’ interface has been a consistent source of frustration. On G2, multiple users describe it as “overwhelming” and “not intuitive.”
SolarWinds works only if you invest the time, money, and patience to keep it running. Most teams today want tools faster to deploy, simpler to manage, and built for the cloud.
SolarWinds Key Features
Before switching tools, it’s worth understanding what SolarWinds still does well. The platform remains strong in traditional network monitoring and IT management, especially for large, on-prem environments. Here’s a breakdown of the main capabilities of SolarWinds:
1. Network & Infrastructure Monitoring
SolarWinds’ flagship feature is its ability to track network devices like routers, switches, firewalls, and servers across large, distributed environments.
What it does
- Monitors real-time performance metrics like bandwidth, latency, and packet loss.
- Provides SNMP and NetFlow-based insights to pinpoint traffic bottlenecks.
- Let’s you build custom dashboards to visualize device health and uptime.
Why it matters
For organizations with complex, multi-site networks, this helps identify connectivity issues before they cause downtime.
However, it’s heavily geared toward on-prem networks and needs manual configuration to integrate with cloud services.
2. Application & Server Tracking
SolarWinds extends beyond hardware to monitor servers and applications across your environment.
What it does
- Tracks CPU, memory, disk usage, and active processes for both Windows and Linux servers.
- Monitors application response times to detect slowdowns early.
- Supports virtual machines (VMware, Hyper-V) and provides dependency mapping.
Why this matters
It gives IT teams a unified view of server and app performance, which is ideal for identifying issues before they impact end users.
However, setup can be time-consuming, and most dashboards require manual tuning to surface the right data.
3. Platform Intelligence & Automation
Recent versions of SolarWinds include some automation features to cut down manual work.
What it does
- Uses AI-driven baselines to detect anomalies or unusual activity.
- Triggers automated alerts and workflows when performance thresholds are breached.
- Generates scheduled reports and performance summaries for audits or management reviews.
- Integrates with tools like ServiceNow, PagerDuty, and Splunk to route alerts automatically.
Why it matters
This makes SolarWinds more proactive than reactive, helping teams respond faster to incidents. Still, many of these “smart” capabilities require add-on modules, and cloud-native tools like Datadog or Dynatrace now offer deeper automation out of the box.
SolarWinds continues to deliver deep visibility across networks and servers. But its strength lies in legacy IT monitoring, not in cloud-native, AI-driven, or hybrid environments.
Common Limitations in SolarWinds
SolarWinds still works well for traditional IT setups, but these gaps make it harder to operate efficiently today:
1. Licensing is complex and costly; each new feature or node adds to your bill.
➡️ Look for alternatives with all-in-one pricing or usage-based billing.
2. Setup and maintenance are time-intensive. Deployment requires databases, local servers, and manual tuning.
➡️ Cloud-based tools like LogicMonitor or Site24x7 deploy in hours, not weeks.
3. Limited automation and AI capabilities, and most processes still rely on manual configuration.
➡️ Modern platforms like Dynatrace or Datadog use AI for anomaly detection and auto-remediation.
4. Steep learning curve with dashboards and alerts taking days to configure.
➡️ Tools like Hiver or Auvik focus on simpler interfaces and minimal onboarding.
5. On-prem dependency limits scalability, as many SolarWinds modules still require physical infrastructure.
➡️ Fully cloud-native options scale instantly without hardware overhead.
SolarWinds gives depth, but not agility. Teams now need tools that are faster to set up and is lighter to maintain.
Making the Switch: Choosing a Better SolarWinds Alternative
SolarWinds had its time. For years, it was the go-to choice for network monitoring. But infrastructure has changed. Teams today run hybrid systems, cloud apps, and distributed environments that evolve weekly. SolarWinds wasn’t built for that pace.
If you’re spending more time maintaining SolarWinds than solving incidents, it’s a signal to switch. The best SolarWinds competitors in 2025, like Hiver, Datadog, Dynatrace, and Auvik, focus on speed, automation, and usability.
They deploy in hours, integrate natively with cloud environments, and give you AI-powered visibility without manual setup or licensing headaches.
Start by assessing what matters most to your team, be it cost, visibility, or automation. Then pilot a few tools. The difference will be clear: modern monitoring should help you move faster and not slow you down.
Frequently Asked Questions
1. What is the best SolarWinds alternative in 2025?
Datadog and New Relic lead for cloud-native monitoring, while Zabbix and Prometheus excel for open-source setups. Hiver is great for IT ticketing and incident management.
2. Is SolarWinds still good?
Yes, but it suits enterprises with complex networks needing deep on-prem control rather than agile, cloud-only teams.
3. Which free tools compare to SolarWinds?
Zabbix, Nagios Core, and Prometheus + Grafana deliver robust performance monitoring without licensing costs.
4. Does SolarWinds have a cloud version?
Yes, SolarWinds Observability provides SaaS-based functionality, but it comes with enterprise-tier pricing.
5. Who is SolarWinds’ biggest competitor?
Top SolarWinds competitors include Datadog, Dynatrace, and ManageEngine OpManager. For teams that prefer simpler, inbox-style visibility and collaboration, Hiver is a great choice.
6. Do companies still use SolarWinds?
Yes, mostly large enterprises with on-prem networks. But many mid-sized IT teams are switching to cloud-first tools like Hiver and LogicMonitor to cut setup time and reduce maintenance overhead.
7. What is the best network monitoring tool?
If you need deep infrastructure monitoring, tools like Datadog or Auvik work best. For teams that also handle internal IT or service requests, Hiver combines monitoring, collaboration, and automation in one familiar inbox-like interface.
Start using Hiver today
- Collaborate with ease
- Manage high email volume
- Leverage AI for stellar service