Skip to content


It’s easy to think your customer service is “going well” just because tickets are being solved. But solving them isn’t the same as keeping customers happy. A customer might get a quick reply, yet still feel frustrated due to multiple reasons.
That’s why Customer Service KPIs matter. They don’t just measure how fast or efficient your team is, they show you whether your service creates real outcomes like – stronger customer loyalty, higher retention, and ultimately more revenue for the business.
I’ll walk you through the essentials in this blog. First, what KPIs are. Then, how they’re not the same as plain metrics. And finally, the ones that can make or break your customer support team.
Table of Contents
- What are customer service KPIs?
- Why tracking KPIs matters in customer service
- 25 Key customer service KPIs to track in 2025
- How to choose the right KPIs for your team
- Tools to measure & track customer service KPIs
- Best practices for making KPIs actionable
- Common mistakes to avoid when tracking KPIs
- Conclusion
- Frequently asked questions (FAQs)
What are customer service KPIs?
Customer Service KPIs (Key Performance Indicators) are measurable values that show how well your support team performs. They help you track speed, efficiency, and customer satisfaction – everything that matters most in service.
It’s important to note that not every metric is a KPI. A metric is just a number, like how many tickets came in today. A KPI, on the other hand, ties directly to performance and outcomes. For example, First Response Time is a KPI because it reflects how quickly your team acknowledges customers, which directly impacts satisfaction.
Why tracking KPIs matters in customer service
The right KPIs show you what’s working, what’s broken, and where your team needs more effort. Without them, you’re just guessing. Let’s break down why customer service KPIs really matter:
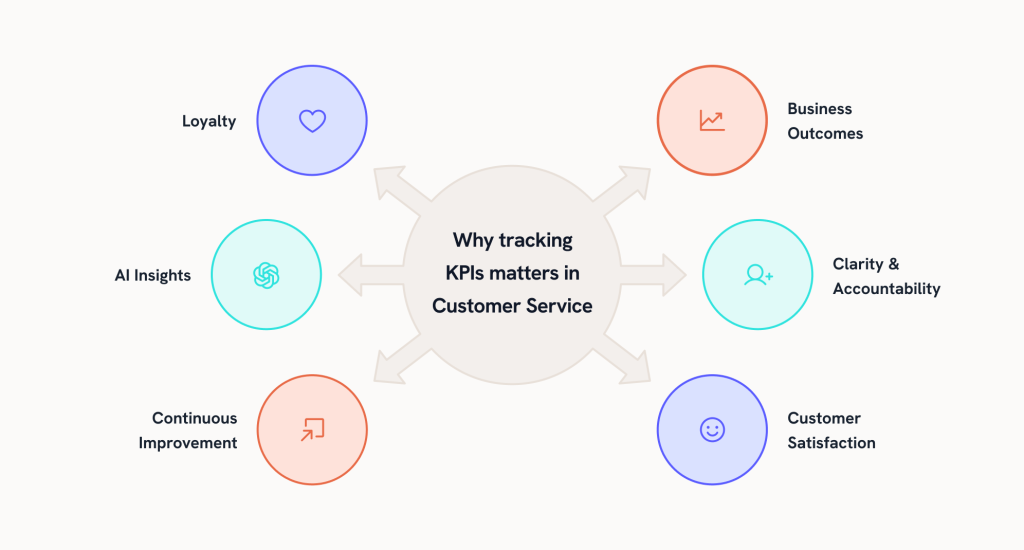
Keeps customers coming back
KPIs show whether your service is building loyalty or slowly pushing customers away. Catching gaps early helps strengthen relationships and boost retention.
Makes business outcomes visible
KPIs connect customer service to the bigger picture. They show leaders how support impacts revenue and long-term customer value.
📊 Fact: 64% of customers expect real-time responses across channels. Without tracking KPIs like First Response Time or Average Wait Time, it’s almost impossible to meet that expectation.
Brings clarity and accountability
KPIs set a clear standard for success. Agents know what’s expected, and managers can see where to improve. This keeps the whole team aligned.
Improves customer satisfaction
With the right service KPIs, customer service teams can respond faster, solve problems better, and deliver service that makes customers feel valued.
Drives continuous improvement
KPIs highlight trends over time, helping teams spot recurring issues and improve processes before small problems become bigger ones.
AI makes it even easier
You don’t need to create reports manually anymore. With reporting and analytics tools built in, patterns show up in real time. The focus shifts from tracking to actually fixing problems.
25 Key customer service KPIs to track in 2025
To keep this simple, I’ll take you through the 25 KPIs in the order they happen. It’s a cleaner way to understand them, and you’ll see how each one plays a role in shaping both the customer experience and the bigger business picture.
Before support
This stage is all about how quickly and easily customers can get through to your team. If things slip here, the experience starts off on the wrong foot.
1. First response time (FRT)
First Response Time measures how long your team will reply to a customer’s first message. A fast response reassures customers that you’re paying attention, even if the full resolution takes longer. Most businesses aim for under 1 hour on email and 1–2 minutes for chat.
📐Formula: Total first response time ÷ number of tickets.
2. Average wait time
This is the amount of time customers spend waiting in a queue before an agent helps them. Long waits are a top source of frustration and can lead to dropped calls or abandoned chats. High-performing teams usually keep this under 2 minutes for calls/chats and within a few hours for email.
📐Formula: Total wait time ÷ number of customers served.
3. Ticket volume
Ticket volume is the total number of support requests received over a given period. Tracking it helps you spot patterns, forecast staffing needs, and understand demand across channels.
📐Formula: Count of total incoming tickets in a given timeframe.
📝ProTip: A sudden spike in ticket volume usually means a product issue—use tags or categories in tools like Hiver to spot patterns faster.
4. Ticket backlog
Backlog refers to unresolved tickets sitting in your queue. A rising backlog signals your team may be understaffed or processes aren’t efficient. The general best practice is to keep backlog below 10% of overall ticket volume.
📐Formula: Number of unresolved tickets at a point in time.
5. Channel mix %
This measures the share of customer requests across different channels like email, phone, chat, and social. It matters because it shows where customers prefer to reach you, helping you allocate resources effectively. For example, chat-heavy support teams should prioritize staffing chat agents.
📐Formula: (Tickets per channel ÷ total tickets) × 100.
6. Abandonment rate
Abandonment Rate tracks the percentage of customers who leave before getting help—whether that’s dropping a call, quitting a chat, or closing a ticket. High abandonment often means wait times are too long or the system isn’t user-friendly. Lowering this is critical to keeping customers engaged.
📐Formula: (Abandoned interactions ÷ total interactions) × 100
During support phase
This stage covers what happens while customers are actively engaging with your team. The focus is on efficiency, problem-solving, and keeping the experience smooth.
7. First contact resolution (FCR)
FCR shows the percentage of issues solved in a single interaction, without transfers or follow-ups. It matters because resolving problems the first time reduces effort for customers and saves agent time. A benchmark many teams aim for is 70–75%.
📐Formula: (Issues resolved on first contact ÷ total issues) × 100.
8. Average handle time (AHT)
AHT is the average time an agent spends handling a request, including talk/chat time and any wrap-up work. It’s important to balance efficiency with quality—shorter isn’t always better if customers feel rushed. Typical benchmarks range from 4–6 minutes for phone and 2–3 minutes for chat.
📐Formula: Total handle time ÷ total resolved tickets.
9. SLA compliance rate
This measures the percentage of tickets resolved within your promised Service Level Agreements (SLAs). It matters because customers expect you to keep the commitments you’ve made. Good customer support teams usually maintain SLA compliance above 90%.
📐Formula: (Tickets resolved within SLA ÷ total tickets) × 100.
10. Transfer rate
Transfer Rate tracks how often a ticket is passed from one agent or team to another. While some transfers are necessary, too many create friction for the customer. A lower transfer rate signals smoother processes and better agent training.
📐Formula: (Transferred tickets ÷ total tickets) × 100.
11. Escalation rate
Escalation Rate shows the percentage of tickets that require manager or specialist involvement. High escalation often points to gaps in training or unclear processes. Ideally, most issues should be solvable at the first level.
📐Formula: (Escalated tickets ÷ total tickets) × 100.
12. Agent utilization rate
This measures how much of an agent’s logged-in time is spent on productive support tasks. It helps ensure agents aren’t overworked or underused. A healthy benchmark is often between 75–85%.
📐Formula: (Time spent on support tasks ÷ total logged-in time) × 100.
13. Ticket reopen rate
This tracks the percentage of tickets customers reopen after they were marked resolved. A high rate usually signals incomplete resolutions or poor-quality answers. Strong teams aim to keep this rate under 5%.
📐Formula: (Reopened tickets ÷ total resolved tickets) × 100.
📝Tip: If your ticket Reopen Rate is above 5%, it’s a red flag. Encourage agents to confirm with customers before closing a case, this simple step keeps reopen rates down.
After support
Once the ticket is closed, it’s time to understand how customers felt about the experience—and whether they’ll continue their relationship with your brand.
14. Customer satisfaction score (CSAT)
CSAT captures immediate feedback after an interaction, usually through a quick survey on a 1–5 scale. It matters because it gives you a direct view of how happy customers are with the service they just received. Strong teams often see scores above 80–85%.
📐Formula: (Number of positive ratings ÷ total responses) × 100.
15. Net promoter score (NPS)
Net Promoter Score measures customer loyalty by asking how likely they are to recommend your company on a scale of 0–10. It matters because promoters drive referrals and long-term growth. A score above +50 is considered excellent across most industries.
📐Formula: % of Promoters (9–10) − % of Detractors (0–6).
16. Customer effort score (CES)
CES asks customers how easy it was to get their issue resolved. Low effort = high satisfaction. It matters because effort strongly predicts loyalty—customers who find it hard to get help are less likely to stay. Top-performing teams aim for CES above 70.
📐Formula: Total CES score ÷ number of responses.
17. Customer retention rate
Retention Rate shows how many customers stick with your brand over time. It matters because retaining customers is far more cost-effective than acquiring new ones. Strong service teams help keep customer retention rates above 90% in most industries.
📐Formula: [(Customers at end − new customers) ÷ customers at start] × 100.
📝Tip: Instead of one overall retention rate, break it down by customer segments (new vs longtime, geography, or product use). It reveals weak spots you might miss otherwise.
18. Customer complaint rate
Complaint Rate measures how often customers file repeat or formal complaints. It’s important because unresolved problems quickly damage trust. Teams typically aim to keep complaint rates below 5% of total interactions.
📐Formula: (Number of complaints ÷ total tickets) × 100.
19. Customer sentiment score
Sentiment Score analyzes the emotional tone of customer messages—positive, neutral, or negative. Often powered by AI, it gives a deeper look at how customers feel beyond survey scores. Consistently high positive sentiment is a sign of strong service quality.
📐Formula: (Positive interactions ÷ total interactions) × 100.
Strategic view
These KPIs connect customer service to business outcomes like revenue, efficiency, and long-term growth.
20. Customer lifetime value (CLV)
CLV estimates the total revenue a business can expect from a customer over their entire relationship. It matters because support quality directly impacts whether customers stay longer and spend more. Companies in SaaS and subscription models often push CLV upward by reducing churn.
📐Formula: Average purchase value × purchase frequency × customer lifespan.
21. Cost per ticket
This KPI measures the average cost of resolving a single support request. It matters because leaders need to balance efficiency with delivering great service. Efficient teams keep costs lower without compromising customer satisfaction. Typical benchmarks range from $2–$5 per ticket for digital-first support.
📐Formula: Total support costs ÷ total tickets.
22. Revenue influenced by support
This shows how much revenue comes directly from support interactions—through upsells, renewals, or cross-sells. It matters because it proves that customer service isn’t just a cost center but a growth driver. Mature customer support teams actively track this to justify investments.
📐Formula: (Revenue linked to support interactions ÷ total revenue) × 100.
23. AI deflection rate
AI Deflection Rate measures the percentage of customer queries resolved by AI or chatbots without human involvement. It matters because every successfully deflected ticket saves agent time and reduces costs. Top-performing teams target at least 20–30% deflection.
📐Formula: (Tickets resolved by AI ÷ total tickets) × 100.
24. Knowledge base self-service rate
This tracks the percentage of customers who found answers through FAQs or help articles instead of contacting support. It matters because effective self-service saves time for both customers and agents. Benchmarks vary, but best-in-class teams see over 40% resolution via self-service.
📐Formula: (Self-service interactions ÷ total support interactions) × 100.
25. Agent productivity per channel
This KPI compares agent performance across different support channels like email, chat, and phone. It matters because it highlights where teams excel, where they struggle, and how resources should be balanced. Benchmarks depend on the channel but are vital for multi-channel operations.
📐Formula: Tickets resolved per agent per channel ÷ total time spent.
How to choose the right KPIs for your team
With so many KPIs to choose from, it’s easy to get lost. You don’t need them all. To make it easier, here are a few simple steps you can follow.

1. Start with your goals
Your KPIs should map directly to your top business goal. For example:
- If loyalty is slipping, track CSAT, NPS, Retention Rate. Aim for CSAT above 80% and NPS above +30 as a baseline.
- If efficiency is the problem, focus on Cost per Ticket and SLA Compliance. World-class teams keep Cost per Ticket under $5 for digital-first support and SLA compliance above 90%.
👉 Always ask: “Does this KPI tell me something about my current priority?” If not, leave it out.
2. Don’t track everything
It’s tempting to monitor every number, but more KPIs leads to more chaos. Pick 5–7 that directly impact business outcomes.
- For small teams, that might be FRT, AHT, CSAT, Ticket Volume, and Backlog.
- For larger teams, it could be CSAT, CLV, SLA Compliance, Cost per Ticket, and AI Deflection Rate.
👉 Use the 80/20 rule: 20% of KPIs will give you 80% of insights.
3. Match your stage of growth
KPIs should reflect where your team is today, not where you wish it was.
- Startups: focus on speed and responsiveness (FRT < 1 hour for email, Resolution Time < 24 hours). These prove reliability early on.
- Scaling companies: start balancing quality with efficiency (CSAT > 80%, SLA Compliance > 90%).
- Enterprises: add revenue-linked metrics like CLV and Revenue Influenced by Support to prove service ROI.
👉 As you grow, shift from tactical (speed) to strategic (business impact).
4. Review and adjust often
Your KPIs should evolve with your business.
- If churn is your top issue this quarter, prioritize Customer Retention Rate and CES.
- Once retention stabilizes, shift focus to Cost per Ticket or Revenue Influenced by Support.
👉 A quarterly KPI review is a good cadence. Ask: “Is this KPI still tied to our most urgent challenge?” If not, replace it.
📝ProTip: Try small tweaks (like changing SLA thresholds, or improving FAQ self-service) and track their effect on a few KPIs (like AHT or FCR). That way improvements are measurable before making big changes.
5. Use tools to keep it simple
Manual spreadsheets quickly fall apart as teams scale. Use reporting and analytics tools to centralize your KPIs.
- Look for dashboards that track SLA breaches, CSAT trends, or First Contact Resolution automatically.
- AI-driven analytics can surface hidden patterns, like rising wait times on one channel, that you might miss manually.
👉 The less time your team spends compiling data, the more time they have to act on it.
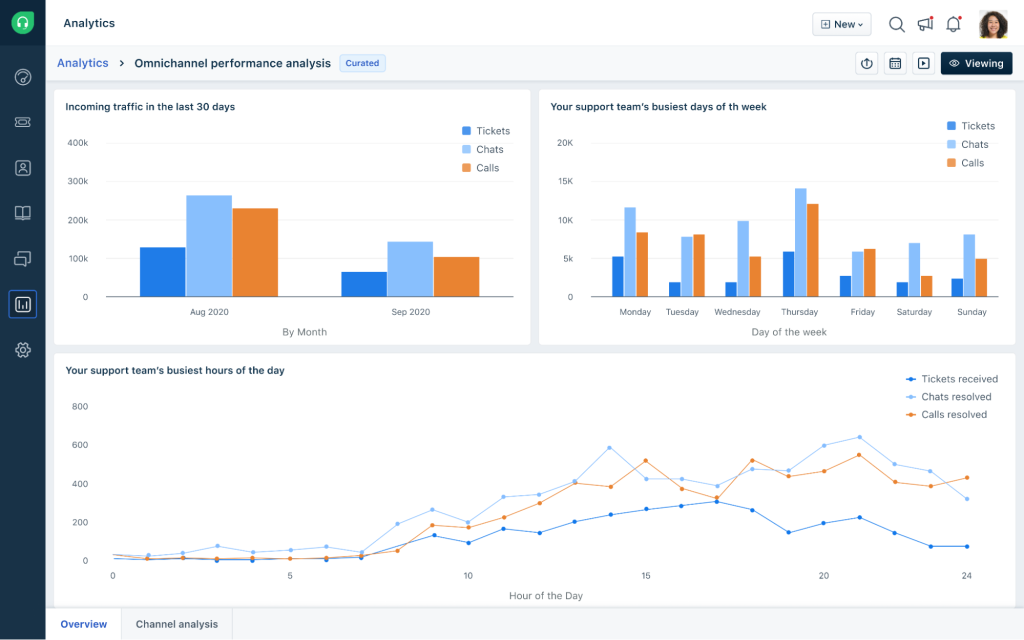
Tools to measure & track customer service KPIs
Numbers only matter if you can track them properly. That’s where reporting and helpdesk platforms step in. Here are the best 5 tools for the job.
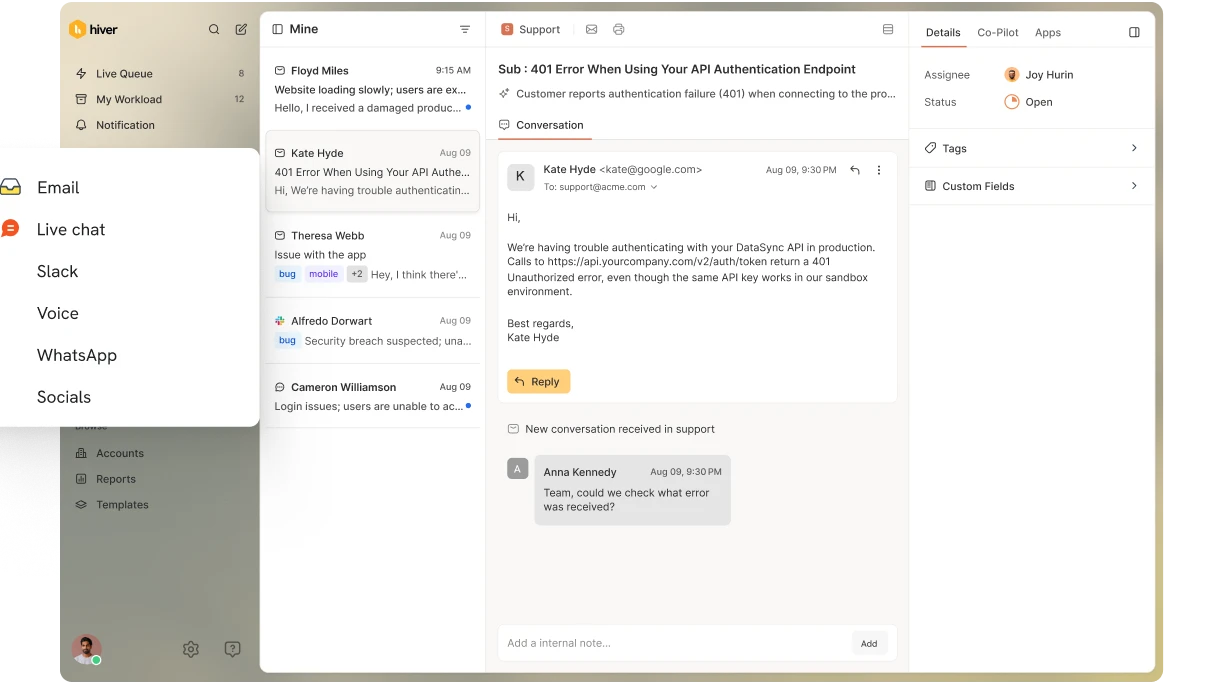
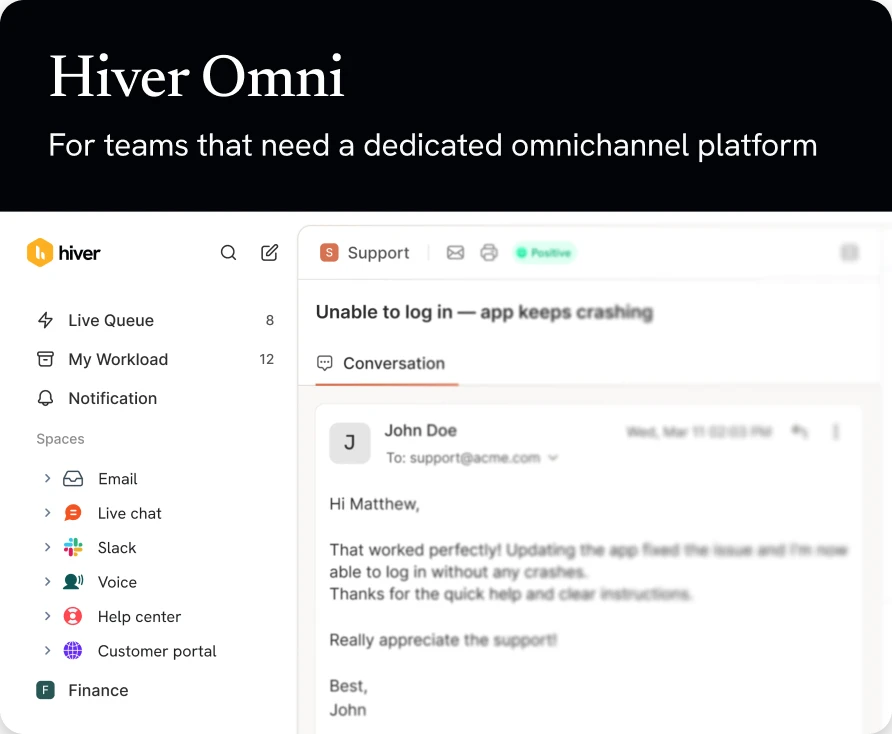
1. Hiver
Hiver is a modern, AI customer service platform. Unify all your customer conversations across emails, chats, calls, and WhatsApp in a single platform, so you can offer fast, contextual support effortlessly.
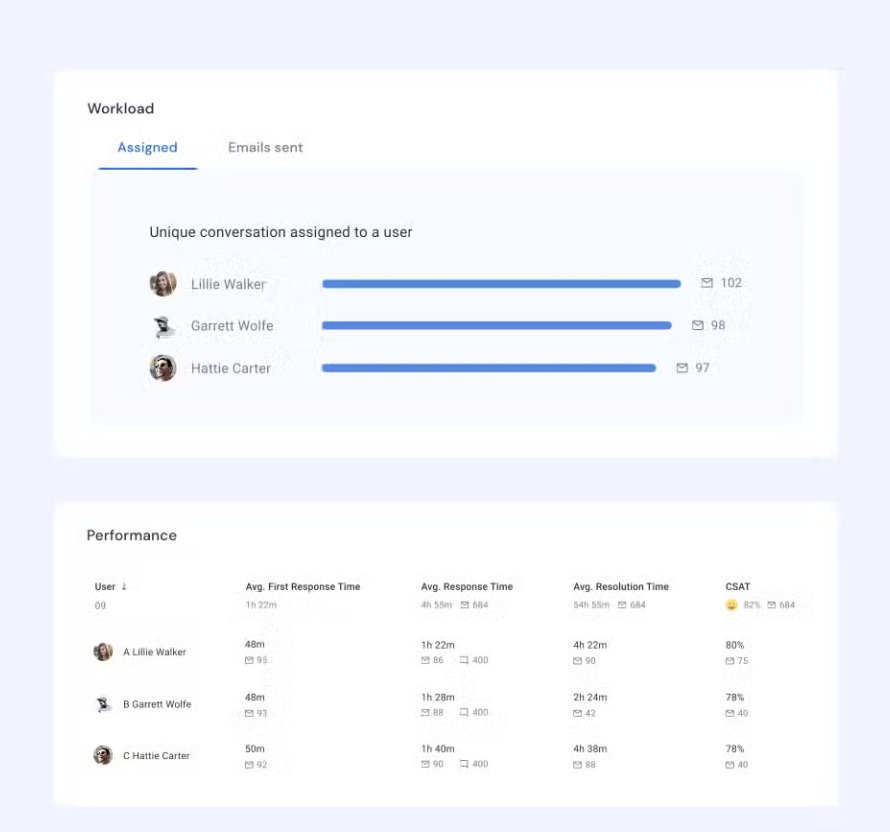
Beyond just handling conversations, Hiver gives you the power to stay on top of your team’s workload, measure performance, and optimize workflows with powerful, real-time analytics. Get data-driven insights that help you improve team performance and deliver better customer experiences.
You can customize dashboards and schedule reports to keep leadership informed with the exact metrics they need. Plus, with clear visibility into workload, Hiver helps you plan headcount more accurately and reduce costs without compromising productivity.
Pricing starts from $19/user/month, and you also get a free forever plan.
Key features:
- Reporting & analytics: Track metrics like First Response Time, Resolution Time, CSAT, and SLA compliance in real time. Customizable dashboards help managers spot trends before they turn into problems.
- SLA management: Set response and resolution deadlines to stay compliant with KPIs tied to service reliability.
- Collaboration tools: Features like email assignment, notes, and collision detection keep workflows efficient—directly influencing KPIs like First Contact Resolution and Ticket Reopen Rate.
- Automation & AI: Auto-tagging, AI-driven response suggestions, and workload distribution reduce handle times and improve efficiency.
2. Zendesk
Zendesk is one of the most widely used customer service platforms, often chosen by enterprises that need scale and flexibility. It supports multiple channels—email, chat, phone, and social—giving businesses a unified view of customer support. For KPI tracking, Zendesk is powerful because of its customization options and deep reporting capabilities.
Pricing starts from $55 per agent/month for the Suite Team plan, and it offers a 14-day free trial on all Suite plans.

Key features:
- Zendesk explore (analytics module): Build custom dashboards to track KPIs like SLA breaches, backlog trends, and customer satisfaction scores.
- Omnichannel reporting: Compare KPIs across channels to see if chat is outperforming phone, or if social media requires more staffing.
- Knowledge base metrics: Monitor self-service usage to measure deflection rates and reduce ticket volume.
3. Freshdesk
Freshdesk is known for balancing ease of use with strong functionality, making it a good fit for mid-sized teams. Its clean interface and affordable pricing appeal to companies that need reliable KPI tracking without a steep learning curve.
Pricing starts from $15 per agent/month, and it offers a 14-day free trial.
Key features:
- Real-time dashboards: Visualize live KPIs like active ticket counts, SLA compliance, and agent availability.
- Freddy AI insights: Identify recurring issues or bottlenecks that are slowing down resolution times and lowering CSAT.
- Workflow automation: Route tickets automatically based on priority or topic, ensuring better SLA performance and lower wait times.
4. HubSpot Service Hub
HubSpot Service Hub is ideal for teams that want to tie customer service performance directly to broader business outcomes. Since it connects natively with HubSpot CRM, it gives you a unified view of customer health, revenue impact, and service efficiency.
Pricing starts from $0/month for the Free plan. Starter plan then starts at $15/month per seat. It also offers a 14-day free trial for many of its paid Service Hub plans.
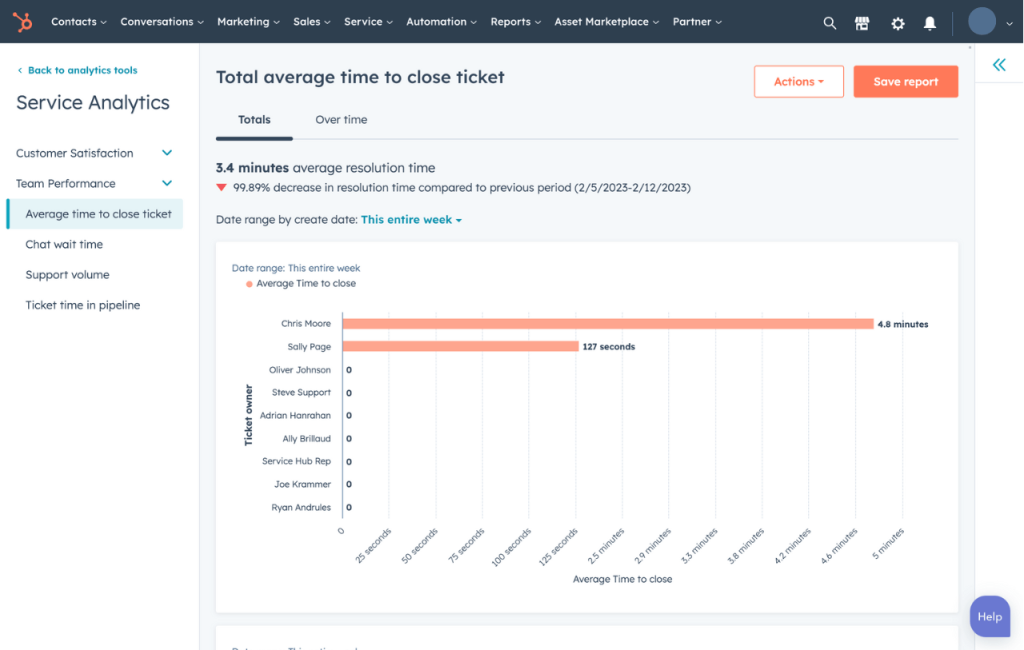
Key features:
- Help desk reporting: Track KPIs like ticket response time, ticket close rate, and agent productivity.
- SLA management: Set and track service commitments for different customer segments.
- Customer feedback tools: Collect CSAT, NPS, and CES directly inside HubSpot and track them alongside sales and marketing data for a 360° view.
5. SimpleKPI
Unlike the others, SimpleKPI doesn’t manage customer tickets directly—it focuses purely on performance tracking and reporting. This makes it a good option for leaders who want flexible dashboards and KPI monitoring across departments, not just service.
Pricing starts from $99/month (for unlimited users, dashboards, reports, and KPIs) and it offers a 14-day free trial.
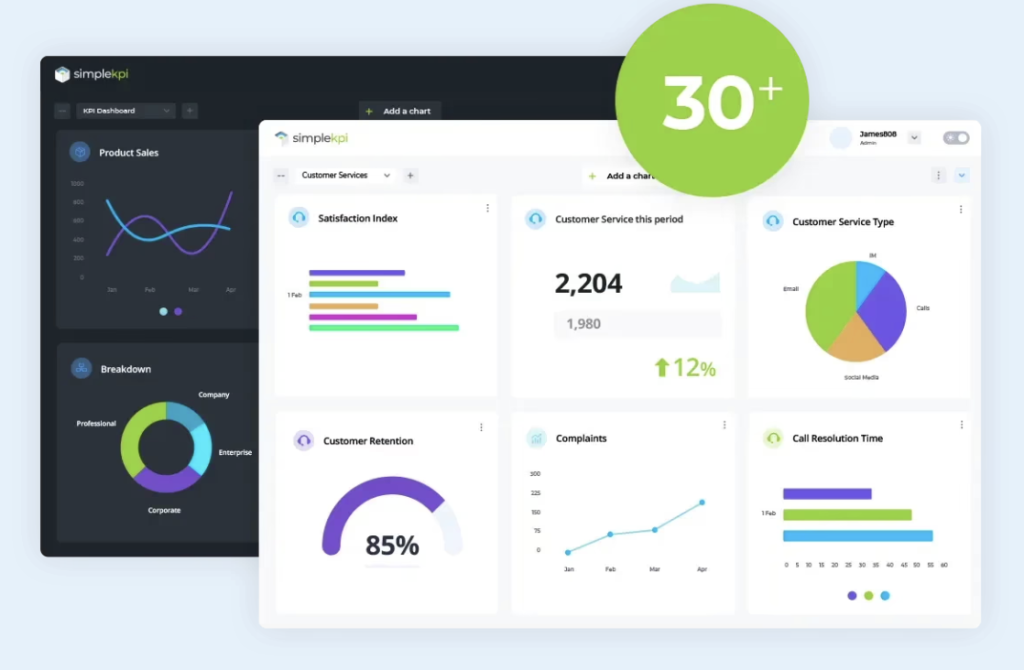
Key features:
- Custom KPI dashboards: Visualize customer service metrics like FRT, AHT, or Retention Rate in simple, interactive charts.
- Collaboration & sharing: Share KPI reports with leadership or cross-functional teams to keep everyone aligned.
- Integrations: Pull data from ticketing systems, CRMs, or spreadsheets to create a single source of truth for KPIs
Best practices for making KPIs actionable
To actually get value from KPIs, you need to use them in a way that drives action. These best practices will help you do exactly that.

Anchor KPIs to your current company goal
If you’re aiming to boost loyalty, put CSAT, Net Promoter Score and retention front and center. If profitability is your concern, cost per ticket and SLA compliance matter more.
Pick focus KPIs
More numbers don’t equal more clarity. Choose 5–7 core KPIs so your team can monitor trends without drowning in data. This keeps everyone aligned and avoids the distraction of chasing vanity metrics.
Set meaningful targets
For example, aim for CSAT above ~80-85%, SLA compliance above 90%, FCR around 70-75%. Adjust by industry and channel, but use numbers you can say yes or no to.
Use qualitative feedback
Numbers show what’s happening, but not why. Pair KPIs with customer verbatims, agent insights, and QA reviews. This context turns raw data into actionable stories you can use to improve workflows and coaching.
Ensure transparency
Share dashboards and results with the whole team, not just leadership. When people see the same KPIs, they know where to focus, where to improve.
Coach around KPIs
Don’t use metrics as punishment. Instead, turn dips in KPIs, like SLA breaches or rising reopen rates, into learning opportunities. Analyze the root cause, then provide the right training, playbooks, or resources to fix it.
Automate everything you can
Real-time dashboards, alerts for breaches, automated reports. When your data is always fresh, action is always possible.
Common mistakes to avoid when tracking KPIs
Even the best teams slip up when it comes to tracking KPIs. Some focus on the wrong numbers, others forget to update them as priorities shift. Here are the most common mistakes to watch out for.
Using vanity metrics
Tracking high ticket numbers or closed-tickets without validating quality (like reopen rate or satisfaction) gives a false sense of performance.
Lack of benchmarks or context
A CSAT of 78% means nothing unless you compare it to industry averages or your own historical data. Without benchmarks, numbers can mislead more than they inform.
📊Fact- According to Sprinkler, improving customer experience can reduce churn by up to 15% and boost win rates by nearly 40%.
Setting too many KPIs
Tracking 15–20 metrics creates noise and overwhelms your team. Focus dilutes, and no single KPI gets real attention. It’s better to pick a handful that connect directly to your goals.
Neglecting frontline feedback
Agents often see the process gaps, unclear workflows, missing resources, or outdated playbooks, that drag KPIs down. Ignoring their input leaves recurring customer issues unresolved and hurts morale.
KPIs that never evolve
What mattered when you were starting up (speed, first response) may not matter later (costs, consistency, revenue impact).
Relying on manual data gathering
Spreadsheets get messy fast, and by the time reports are ready, the data is outdated. Manual tracking also increases the risk of errors that skew decisions.
Mixing up metrics and KPIs-
Not every metric is worth being a KPI. Daily ticket volume is just a number; First Response Time is a KPI because it ties directly to customer satisfaction.
Always ask: “Does this metric reflect performance?”
Conclusion
At the end of the day, KPIs are there to give you clarity. The key is to focus on the few that truly reflect your team’s performance, track them consistently, and use the insights to make better decisions for your customers and your business.
That’s where the right tool really helps. Tools like Hiver give you built-in reporting and analytics, so your key KPIs—like First Response Time, CSAT, and SLA compliance.
You can even try it out with a 7-day free trial to see the difference for yourself!
Frequently asked questions (FAQs)
What is the most important KPI in customer service?
There isn’t just one, but Customer Satisfaction Score (CSAT) is often the most important because it tells you if customers are actually happy with your service. A high CSAT means your team is solving problems in a way that keeps customers satisfied.
How do you measure customer service success?
You measure success by tracking KPIs like First Response Time, Resolution Time, CSAT, NPS, and Retention Rate. These show if your team is fast, effective, and keeping customers loyal.
What’s the difference between CSAT and NPS?
CSAT measures short-term satisfaction after an interaction, while NPS measures long-term loyalty by asking if customers would recommend your company. Think of CSAT as “Did we help you well today?” and NPS as “Will you stick with us tomorrow?”
How many KPIs should a support team track?
It’s best to track 5–7 core KPIs at a time. Tracking too many creates noise and makes it hard to focus. Choose the ones that match your current goals—like loyalty, efficiency, or cost.
What tools can help track customer service KPIs?
Tools like Hiver, Zendesk, Freshdesk, and HubSpot Service Hub make KPI tracking easier with built-in reporting dashboards. They save you from spreadsheets and show you trends in real time.
Start using Hiver today
- Collaborate with ease
- Manage high email volume
- Leverage AI for stellar service