In 2025, customers expect fast, personalized, and hassle-free service. And if businesses can’t deliver on this promise, they’re quick to switch.
According to a survey by Hiver, 72% of customers switch brands after just one poor support experience, and over half expect their issues to be resolved within 24 hours.
The takeaway is simple: customer support teams have little margin for error. They need to consistently deliver prompt, efficient support, and this is not possible without the right technology.
Modern customer service software does more than just close tickets. From AI help desks and knowledge bases to live chat and team collaboration, these tools help your support team respond faster, share answers instantly, and keep every customer conversation on track, no matter how many queries come in.
In this guide, we’ve curated 10 of the most essential customer support tools to consider in 2025. Whether you’re upgrading your tech stack or scaling a growing team, this list will help you identify the right tools to improve service quality and scale efficiency.
Table of Contents
- What is a customer support tool?
- 10 Essential Customer Support Tools to Power Your Business
- Bonus: What Reddit Users Are Saying About Customer Support Tools
- Set Your Support Team Up for Long-Term Success
- FAQs on Customer Support Tools
What is a customer support tool?
A customer support tool is any software or platform that helps companies manage, track, and resolve customer issues more efficiently — across channels like email, chat, phone, and social media.
As a company scales, so does the volume and complexity of customer requests. What starts as a manageable flow of emails can quickly become an overwhelming mix of tickets from multiple communication channels. That’s where customer support tools step in.
They centralize conversations, route tickets to the right agents, and provide full customer context, so your team can respond faster, more accurately, and with less effort. But their value doesn’t stop there.
Modern customer support automate repetitive tasks like ticket assignment, FAQ responses, and team collaboration. Some even use AI to suggest replies or summarize long conversations, freeing up agents to focus on high-impact work.
10 Essential Customer Support Tools to Power Your Business
We’ve done the groundwork for you — here’s a round-up of our top customer service tools:
1. Help Desk Ticketing Systems
As businesses scale, customer conversations pour in from every direction: email, live chat, IVR, and social media. Without a centralized system, it’s easy for support requests to fall through the cracks or overwhelm your customer service agents.
That’s where a help desk ticketing system comes in. It is a platform that allows support teams to log, assign, track, and resolve customer issues, all from a single interface.
✅ Top Help Desk Tools in 2025
| Tool | Best Known For |
| Hiver | AI-powered help desk with multi-channel support, automation, and analytics. Extremely easy to use, set up time < 10 minutes. |
| Zendesk | Customizable, enterprise-grade ticketing with AI agents and deep integrations. |
| Freshdesk | Omnichannel support, Freddy AI assistant, and strong automation. |
| Zoho Desk | Budget-friendly ticketing with sentiment analysis and Zoho suite integration. |
| Tidio | Ticketing system automation, workflow automations, and AI agent Lyro for website chat and email |
🌟 Why Hiver Stands Out
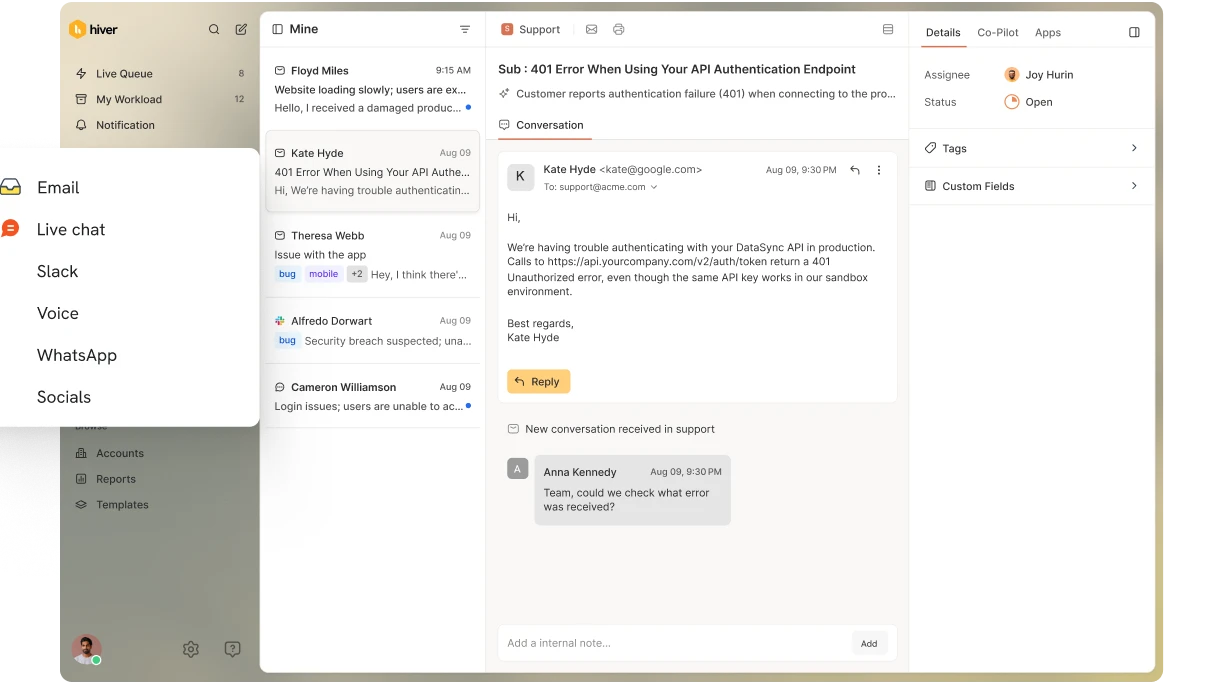
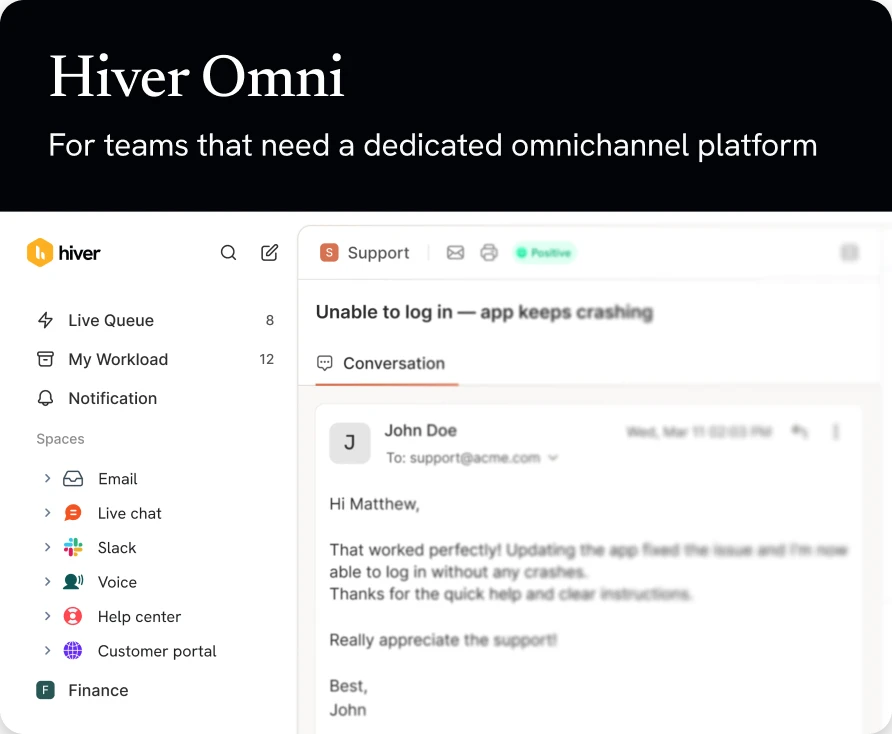
Most help desk software requires teams to learn entirely new platforms. Hiver flips the script by combining the power of a help desk—ticketing, automation, analytics, collaboration— with an interface that’s as easy to navigate as your inbox.

When you install Hiver, you’d notice how all customer emails, chats, phone calls, WhatsApp messages, and even internal work emails can be managed from a collaborative dashboard. Automation rules help distribute tickets based on load or expertise, while built-in analytics track key support metrics like response times, resolution rates, and CSAT scores.
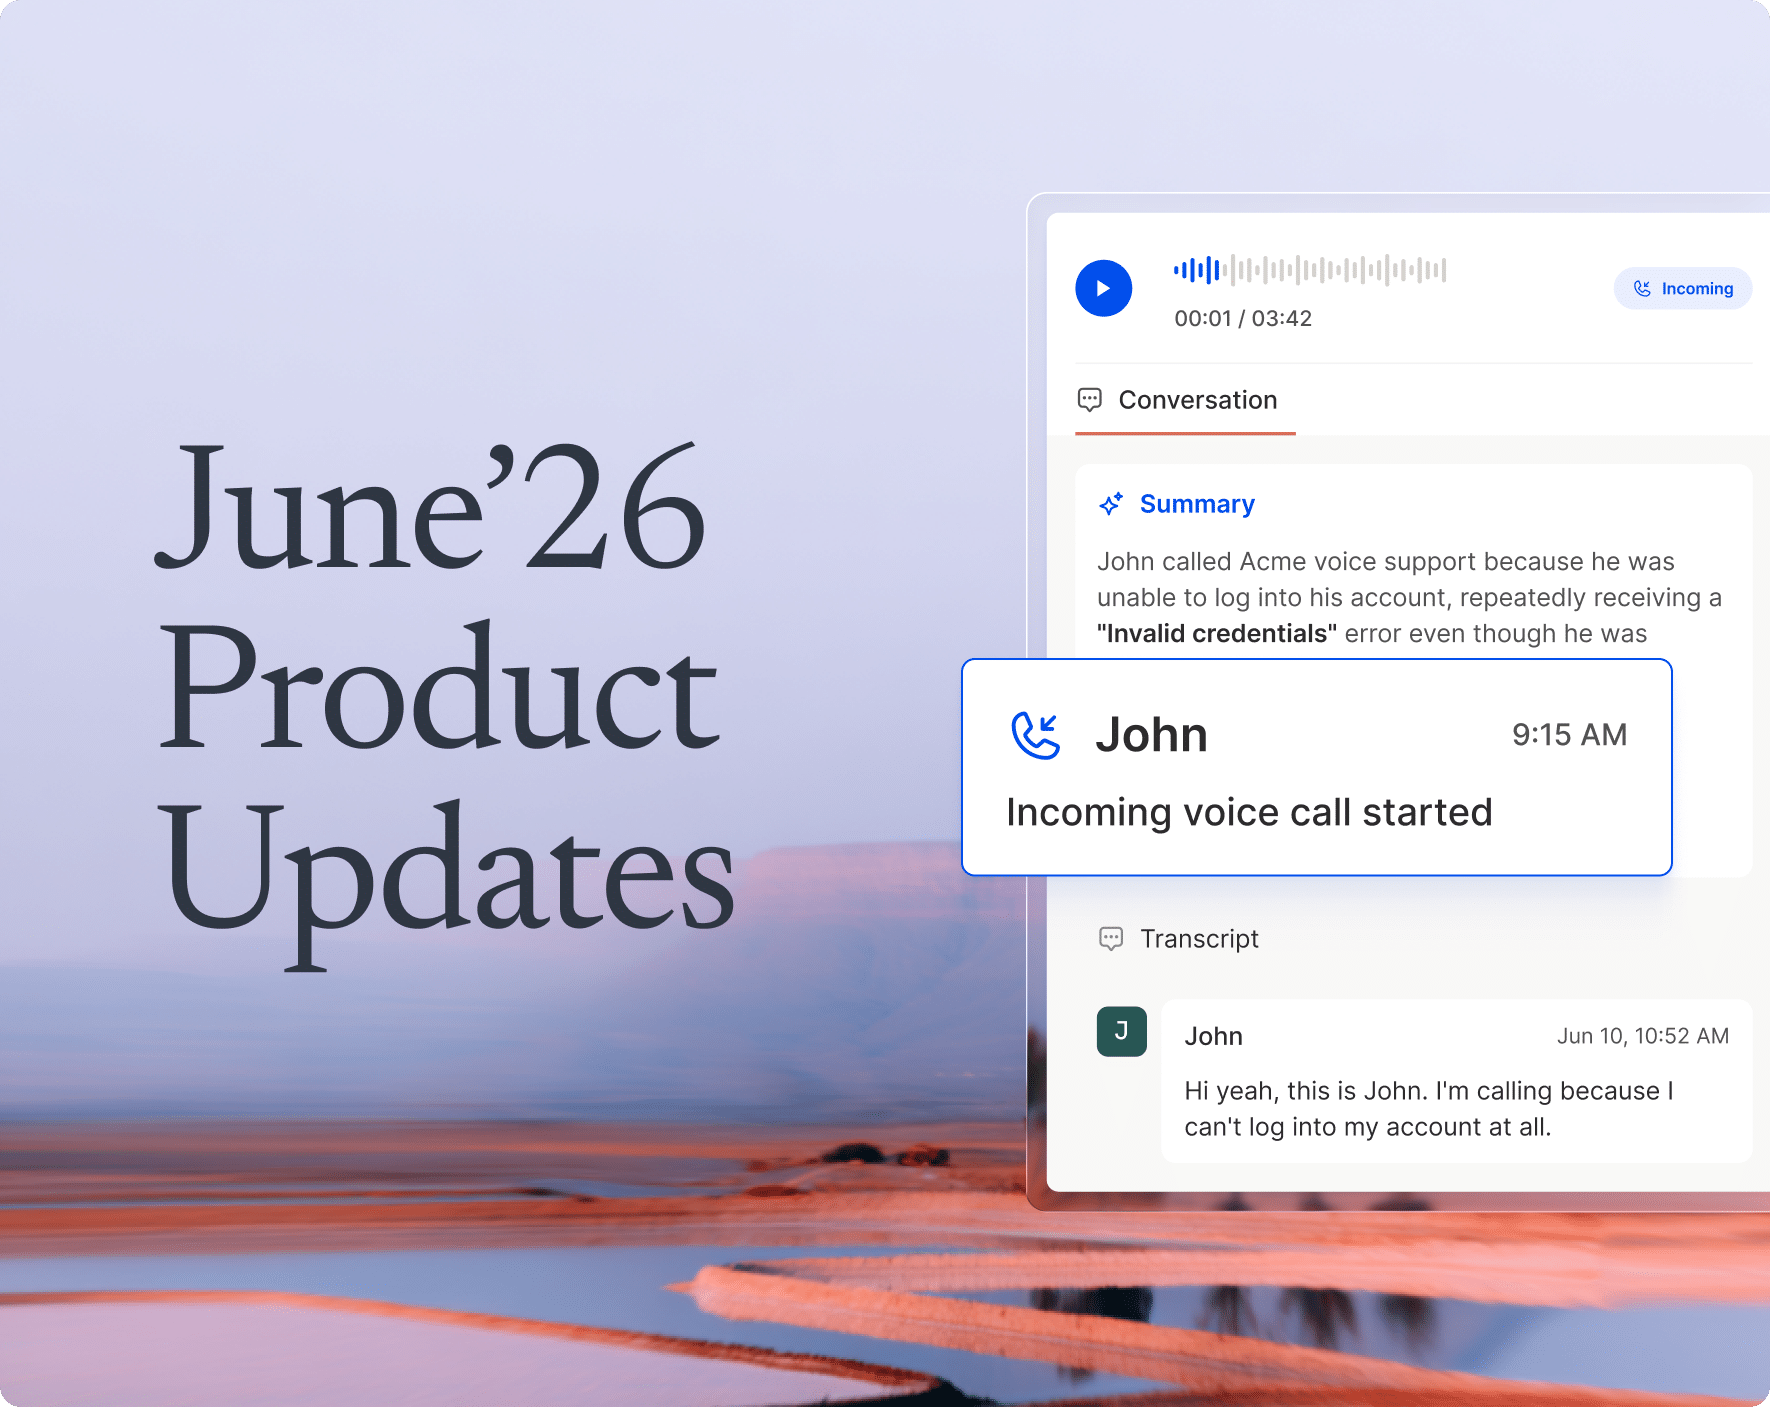
Its AI features are also worth highlighting. Hiver’s AI Co-pilot scans your knowledge base to suggest relevant responses, summarizes conversations, drafts polished replies, and surfaces answers from connected tools. Alongside this, AI Agents handle the heavy lifting of triage, routing, thank-you closures, and even multi-step resolutions like processing refunds. To close the loop, AI Insights tracks sentiment, flags potential churn risks, measures automation performance, and highlights emerging trends. Together, these capabilities save agents time, ensure consistency, and help teams deliver faster, more proactive support.
🧾 What to Look for in a Help Desk Ticketing System
- Channel Support: Does it cover all the channels your customers use (email, chat, phone support, etc.)?
- Ease of Use: How easy is setup and onboarding? Can new agents learn it quickly?
- Automation & AI: Does it automate ticket routing, offer AI reply suggestions, or support chatbots?
- Collaboration Features: Does it support shared inboxes, notes, and drafts for team workflows?
- Integrations: Does it connect with your CRM, Slack, or other core tools?
- Reporting & Analytics: Can you monitor key metrics like resolution time and CSAT?
- Compliance: Does it meet industry standards like GDPR, HIPAA, etc.?
- Pricing: Is it per agent, per ticket, or flat rate? Are there hidden costs?
2. Knowledge Base Software
Today’s customers are used to finding answers on their own. According to Harvard Business Review, 81% of customers try to resolve issues independently before reaching out to a support rep.
A knowledge base makes that possible. It’s a centralized, searchable library where you can publish FAQs, how-to articles, troubleshooting guides, and even video tutorials. For customers, it’s an easy way to get instant help without waiting. For support teams, it’s a way to deflect repetitive queries and focus on high-value tasks.
Knowledge bases also double as internal tools, helping your customer service representatives, like Simply Contact, refer to verified solutions while handling tickets.
✅ Popular Knowledge Base Tools in 2025
| Tool | Best Known For |
| Hiver | Built-in knowledge base accessible within the helpdesk—no tab-switching needed. |
| ProProfs KB | Highly customizable and includes quizzes and surveys for interactive support. |
| Helpjuice | Designed for scaling teams with advanced search and flexible branding options. |
| Knowmax | AI-powered platform with visual workflows, decision trees, and guided content creation. |
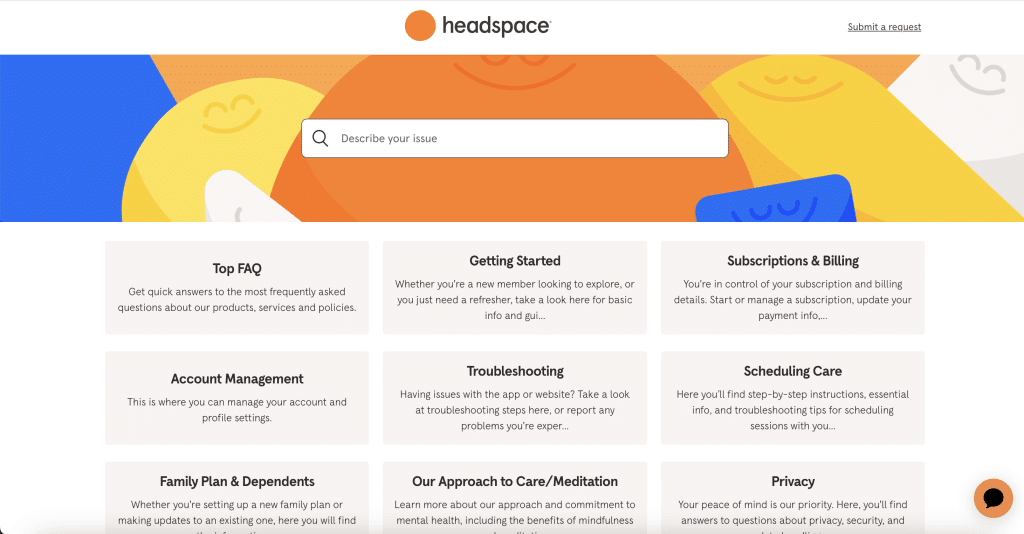
Looking for inspiration? Check out Headspace’s help center. It’s clean, well-organized, and categorized into intuitive sections like “Getting Started” and “Subscription & Billing.” Each article is short, easy to understand, and often includes visuals. This is a great example of how to build a knowledge base for effortless self-service.
🧾 What to Look for in a Knowledge Base Solution
- Use Case Fit: Do you need the customer support tool for self-service, internal knowledge sharing, or both?
- Ease of Content Management: Can your team create, update, and organize content without technical help?
- Integrations: Does it connect smoothly with your helpdesk, CRM, and other tools in your stack?
- Reporting & Analytics: Can you track user searches, content performance, and identify content gaps?
- Search Experience: Does it offer fast, intuitive, and contextual search so users can find answers easily?
Recommended reading
Still unsure which helpdesk fits your team? Take this quick quiz to find out.
3. Live Chat Software
Live chat has become one of the most preferred channels for customer support — and for good reason. According to Invesp, customers who use live chat spend 60% more per purchase, and 77% won’t buy from a website that doesn’t offer it. Interface clarity plays a major role in live chat adoption. Superside’s research on chat interface design examines how balanced layouts, accessible color systems, and well-timed triggers can improve responsiveness and overall customer satisfaction.
It’s fast, familiar, and convenient. Whether customers are browsing your site or using your app, live chat lets your team engage proactively and resolve issues in real time, without needing to switch channels.
✅ Top Live Chat Tools in 2025
| Tool | Best Known For |
| Hiver | Multichannel support with live chat support, email, voice, and WhatsApp channels in one inbox. Includes chat automation, AI reply suggestions, and smart triggers. |
| Pure Chat | Simple, standalone chat tool for small businesses. Offers file sharing and visitor tracking. |
| WotNot | No-code chatbot platform with customizable templates, AI bots, and live chat across channels. |
| LiveChat | Real-time messaging with chat routing, visitor insights, and robust integrations. |
Pro Tip: Live chat is powerful, but only if implemented well. A clunky or unresponsive chat experience can do more harm than good. Read this guide on live chat do’s and don’ts to get it right.
🧾 What to Look for in Live Chat Software
- Use Case Fit: Will it serve your support team, sales team, or both?
- Automation & Bots: Does it support chatbots, canned responses, and automated routing?
- Analytics: Can you track key metrics like response times, resolution rates, and CSAT?
- Customization: Can the chat widget be styled to match your brand’s tone and design?
Recommended reading
4. Social Listening and Monitoring Tool
Customers talk about your brand long before they contact your support team and it’s not always in your DMs.
That’s where social listening and monitoring tools come in. They help you track brand mentions, trending conversations, competitor activity, and customer sentiment across platforms like X (Twitter), LinkedIn, Instagram, and Reddit.
For support and CX teams, these insights are invaluable. You can proactively resolve public complaints, identify patterns in user pain points, and feed feedback into your product roadmap. It’s also a powerful way to stay responsive during potential crises or high-velocity feedback loops.
✅ Top Social Listening Tools in 2025
| Tool | Best Known For |
| Hootsuite | Social campaign management and brand monitoring across multiple platforms. |
| Sprout Social | Unified dashboard for publishing, analytics, audience engagement, and sentiment tracking. |
| BuzzSumo | Combines social listening with content discovery and influencer tracking. |
Example in Action: Spotify noticed users in the UK and Ireland asking for its AI DJ feature across social media. By listening closely, they rolled it out specifically for Premium users in those regions, turning feedback into action.

🧾 What to Look for in a Social Listening Tool
- Platform Coverage: Does it track conversations across the platforms your customers use most (e.g., LinkedIn, X, Instagram, Reddit)?
- Real-Time Alerts: Does it notify you of spikes in mentions or potential crises as they happen?
- Actionable Insights: Does it go beyond data collection to offer sentiment analysis, topic clustering, and competitor comparisons?
Recommended reading
5. Customer Feedback Software
Every customer interaction is an opportunity to learn from, and feedback tools help you do exactly that.
By allowing companies to send targeted surveys after key touchpoints—like an email exchange, live chat, or product delivery—they help understand how customers felt about the experience.
These insights you gain from these surveys go far beyond a simple satisfaction score. Companies can identify trends, surface recurring pain points, and track key customer experience metrics like CSAT, NPS, and CES over time. More importantly, acting on this feedback shows customers that their voice genuinely matters.

✅ Top Customer Feedback Tools in 2025
| Tool | Best Known For |
| Hiver | Built-in customer satisfaction surveys (CSAT) added automatically to post-interaction emails. |
| SurveyMonkey | AI-assisted survey creation with templates, sentiment analysis, and advanced customization. |
| Typeform | Interactive, conversational-style forms that increase survey engagement and completion rates. |
💡 Best Practices for Designing Feedback Surveys
- Keep it short: Focus on essential questions only.
- Avoid jargon: Use clear, simple language.
- Mix formats: Combine rating scales, multiple choice, and open-text questions.
- Don’t double-barrel: Ask one thing at a time (e.g., avoid “How was the product and service?”).
- Be timely: Send surveys immediately after the interaction.
- Test before you send: Review the flow and clarity with your team.
🧾 What to Look for in a Customer Feedback Tool
- Trigger Options: Can surveys be sent automatically after chats, emails, or calls?
- Feedback Types: Does it support CSAT, CES, and NPS questions? Can you customize question types?
- Ease of Use: How intuitive is the survey builder? Can non-technical teams manage it?
- Analytics & Insights: Does it help visualize trends, identify outliers, and analyze open-ended feedback?
- Integrations: Can it plug into your helpdesk, CRM, or email tools to auto-trigger and track results?
Recommended reading
6. Internal Communication Software
Even the best support agents don’t always have the answer. Sometimes resolving a ticket involves checking with engineering, getting approval from finance, or aligning with product teams.
That’s where internal communication software becomes essential. It enables agents to collaborate with teammates—across functions and time zones—in real time, without switching tools or waiting on email chains.
✅ Top Internal Communication Tools in 2025
| Tool | Best Known For |
| Slack | Real-time messaging with channels, huddles, DMs, and robust integrations for internal and external teams. |
| Microsoft Teams | Chat, video, and collaboration hub built into the Microsoft 365 suite. Great for cross-department visibility. |
| Fellow.app | AI-powered meeting management for streamlined agendas, notes, and post-meeting follow-ups. |
| Hiver | Inline Email Notes for private, contextual discussions on customer emails. Shared Drafts allow real-time collaboration on replies. |
Did you know that poor internal communication can negatively impact your bottom line? According to a Harvard Business Review study, 25% of employees said that miscommunication and communication barriers led to lost sales.
🧾 What to Look for in Internal Communication Software
- Real-Time Collaboration: Does it enable quick messaging, updates, and decision-making?
- Support for Remote/Hybrid Work: Does it offer video calls, file sharing, and mobile access?
- Clarity & Organization: Does it reduce clutter with threads, mentions, channels, or conversation filters?
- Privacy & Security: Does it offer private chat, access controls, and encryption?
Recommended reading
7. Project Management Tool
Great customer service goes beyond ticket resolution. Support teams often juggle tool onboarding, documentation updates, workflow redesigns, and training—all while managing day-to-day queries.
That’s why project management tools are so important. They help teams break down complex initiatives into manageable tasks, assign ownership, track deadlines, and collaborate cross-functionally.
For support teams, this means fewer things fall through the cracks, and internal projects actually ship on time.
✅ Top Project Management Tools in 2025
| Tool | Best Known For |
| Asana | AI-assisted task management with rules, triggers, and deadline automation. Great for structured project tracking. |
| ClickUp | Flexible all-in-one workspace that covers tasks, docs, goals, and time tracking. Highly customizable. |
| Timely | Automatic time tracking and project dashboards to monitor hours, budgets, and workload trends. |
🔗 Integrate Hiver with Asana: Streamline Support and Project Workflows
Support teams often need to translate customer conversations into actionable tasks for other departments. Manually copying information between tools can be time-consuming and error-prone.
By integrating Hiver with Asana, you can bridge this gap directly within Gmail. This integration allows your team to create, view, and manage Asana tasks without leaving their email interface, ensuring seamless collaboration between support and other functions.

🧾 What to Look for in Project Management Software
- Workflow Fit: Can the customer support tool adapt to your team’s way of working, or does it force a rigid structure?
- Task Tracking: Can you assign tasks, set deadlines, and monitor project status at a glance?
- Integrations: Does it connect with your helpdesk, CRM, calendar, or time-tracking tools?
- Collaboration Features: Does it support comments, shared boards, file uploads, and stakeholder visibility?
Recommended reading
A Complete Guide to Email Project Management [+Discover the Best Tool for 2025]
8. Community Forum Platforms
Support teams often spend hours answering the same customer questions over and over. That’s not just inefficient, it’s frustrating for everyone involved.
Community forum platforms offer a smarter alternative. They provide a space for customers to post questions, share tips, offer workarounds, and help each other—without relying entirely on your support team.
These forums also serve as a source of insight into customer pain points. If done right, you’ll spot recurring issues, content gaps in your knowledge base, and opportunities to improve your product experience.
✅ Top Community Forum Tools in 2025
| Tool | Best Known For |
| Higher Logic Vanilla | Q&A upvoting, gamification, AI moderation, and SaaS integrations in a flexible platform. |
| Discourse | Open-source discussion boards with robust moderation, plug-ins, and SSO support. |
| Bettermode | Customizable, white-labeled communities with analytics, AI moderation, and CRM integrations. |
🔍 Example: How Hiver Builds Its User Community
The Hiver Community is built around clear, topic-driven channels that make it easy for users to connect, collaborate, and stay updated.
Members can:
- Join product-focused discussions
- Share ideas and feature feedback
- Get early access to new updates
- Earn loyalty rewards through active participation
With dedicated sections for introductions, product updates, and customer support, Hiver’s forum structure keeps things organized and welcoming. Plus, its straightforward sign-up flow and user-friendly layout make it easy for new members to get started.

🧾 What to Look for in a Community Forum Platform
- Purpose & Customization: Can you structure the forum around clear topics and user groups? Does it support branding and flexible layouts?
- Moderation & Safety: Are there tools for AI-powered moderation, spam control, and user management?
- Engagement Features: Does it support gamification, upvotes, badges, and notifications?
- Integration Support: Can you link it with your CRM, knowledge base, support desk, or newsletters?
9. Customer Relationship Management (CRM) software
A Customer Relationship Management (CRM) system is more than just a sales tool. For support teams, it’s the single source of truth for everything a customer has ever done—from emails and chat conversations to purchases and past issues.
Instead of bouncing between tools, agents can see the full customer lifecycle and journey at a glance. This makes it easier to deliver personalized support, follow up effectively, and build long-term trust.
Plus, most CRMs come with automation, reporting, and integrations that can help businesses stay on top of customer needs in real time.
✅ Top CRM Tools in 2025
| Tool | Best Known For |
| HubSpot | Free, user-friendly CRM with sales, marketing, and support tools in one clean interface. |
| Salesforce | Highly customizable CRM with advanced automation, AI-driven insights, and enterprise scalability. |
| Zoho CRM | Affordable multichannel CRM with smart workflows, reporting, and AI sales assistance. |
| Pipedrive | Lightweight CRM designed for simplicity, pipeline tracking, and task automation. |
Did you know? 93% of companies see improved customer retention after implementing a CRM, according to recent industry research.
🧾 What to Look for in a CRM for Support Teams
- Customer Data Centralization: Does it store emails, calls, chat logs, and purchase history in one place?
- Automation Capabilities: Can it automate routine tasks like follow-ups, reminders, or data capture?
- Reporting & Insights: Does it offer dashboards to track customer trends, churn risk, or service metrics?
- Integrations: Can it connect easily with your helpdesk, email, live chat, and marketing tools?
Recommended reading
What is Customer Relationship Management (CRM)? Types, Benefits, and Trends
10. AI Support Tools
Not every company can afford to hire, train, and manage a large support team. And even those that can often find themselves drowning in repetitive tickets that burn out agents.
This is where AI support tools make a real difference. They empower lean customer service teams to handle large volumes of queries, without expanding headcount.
Check out what Alex Rainey, Founder of MyAskAI.com, has to say about AI’s role in the support landscape today:

“There are lots of use cases in business today where AI isn’t quite ready, and we might need to wait 6-12 months. But for 1st line customer support, it’s production-ready. Looking at what we’re seeing, like 70%+ of support tickets resolved by AI with My AskAI, or the results shown by Intercom Fin AI or Ada, it’s all showing how AI is delivering real value for businesses today, and not just hype or promises for tomorrow.”
Alex Rainey
Founder of MyAskAI.com
Whether it’s a chatbot deflecting FAQs, a co-pilot drafting email replies, or an AI engine routing tickets to the right person, these tools help automate frontline support and resolve issues faster.
✅ Top AI-Powered Support Tools in 2025
| Tool | Best Known For |
| Forethought | Automates ticket triage, suggests responses, and integrates deeply with knowledge bases. |
| Decagon | AI agent that handles full conversations across channels—no human handoff needed. |
| Dixa | Combines multichannel communication with smart routing and task automation. |
| Zowie | AI chatbots and self-service flows that deflect repetitive queries and free up human agents. |
🧾 What to Look for in an AI Support Tool
- Repetitive Task Automation: Can it handle FAQs, ticket routing, or draft responses?
- Ease of Setup & Training: Is the setup intuitive? Can it learn from existing workflows or past tickets?
- Real-Time Support Features: Does it offer response suggestions, summaries, or co-pilot-style assistance?
- Learning Capabilities: Can it improve over time based on customer interactions?
- Tool Integrations: Does it integrate with your helpdesk, CRM, or knowledge base?
Recommended reading
Bonus: What Reddit Users Are Saying About Customer Support Tools
When it comes to choosing the right support tool, nothing beats hearing from people who’ve already been in the trenches. We scoured Reddit for some discussions where small business owners, SaaS founders, and e-commerce managers share what’s worked (and what hasn’t) for them. Here are a few threads worth exploring, and some quick takeaways:
1. Best customer support tool with multichannel support (r/smallbusiness)
👉 Many users recommend Freshdesk and Hiver for ease of setup, while others mention Zendesk as powerful but often too complex for smaller teams.
2. Helpdesk/customer support tool with a good free plan (r/SaaS)
👉 Startups in this thread leaned toward Zoho Desk and Freshdesk for their free tiers, but pointed out limitations once teams scale.
3. Customer support tools (r/SaaS)
👉 Here, founders debated the trade-off between “all-in-one” platforms like Zendesk and more focused tools that keep things simple, like Hiver or Front.
4. Decent customer support tool for email, tickets and surveys (r/ecommerce)
👉 E-commerce folks emphasized the importance of survey features alongside ticketing, with Gorgias often mentioned as a Shopify-friendly choice.
Our takeaway: Reddit chatter mirrors what we’ve seen with our own customers: the “big names” often come up first, but when teams want something easy to adopt and genuinely collaborative, tools like Hiver tend to stand out.
Set Your Support Team Up for Long-Term Success
To do customer support really well, you need the right tools. They enable your team to manage conversations across channels, gather meaningful feedback, collaborate internally, automate routine tasks, and track performance, all from a unified workspace.
But more tools don’t always mean better support. When systems are fragmented and data is scattered, even the best teams can struggle to keep up.
That’s why it’s important that your customer service strategy prioritizes tools that are not just powerful, but also easy to use, well-integrated, and tailored to your team’s real-world needs.
The goal is simple: less friction for your team, and better service for your customers.
FAQs on Customer Support Tools
1. How can a help desk ticketing system benefit customer support teams?
A help desk ticketing system centralizes customer inquiries from multiple channels, allowing support teams to manage, prioritize, and track issues efficiently. It facilitates collaboration among agents, automates routine tasks, and provides analytics to monitor performance metrics like response times and customer satisfaction.
2. What are the best customer service software in 2025?
In 2025, businesses are adopting integrated customer service platforms to streamline customer support. Some of the best customer service tools include:
- Help Desk: Zendesk, Hiver, Freshdesk, Zoho Desk
- CRM: Salesforce, HubSpot
- Live Chat: LiveChat, Intercom
- Knowledge Base: Helpjuice, Document360
- Internal Communication: Slack, Microsoft Teams
- Social Listening: Sprout Social, Hootsuite
- Customer Feedback: SurveyMonkey, Typeform
- Community Forums: Discourse, Higher Logic
- Project Management: Asana, ClickUp
- AI Automation: Zowie, Forethought
3. What are the benefits of using customer support software?
Customer support tools help streamline the way your team manages interactions, collaborates internally, and measures success. Here are the key benefits:
- Faster Resolution Times: Tools like help desks and AI assistants reduce back-and-forth by routing tickets, suggesting replies, or surfacing relevant knowledge.
- Multi-Channel Coverage: Support teams can manage conversations across email, chat, voice, and social media—all from one place.
- Improved Collaboration: Internal communication and project management tools help agents loop in teammates, escalate issues, and close the loop faster.
- Better Customer Insights: Feedback surveys and CRMs can help you understand long-term customer behavior and improve customer satisfaction scores.
- Scalability: Automation and self-service options help lean teams support growing customer bases without burning out.
By simplifying workflows and centralizing communication, these tools allow your team to focus on what matters most—resolving customer issues quickly and effectively.
4. Which AI tools are best for automating customer support?
AI tools enhance customer support by automating responses, routing tickets, and providing real-time assistance. Notable AI tools include:
- Zowie: Automates customer interactions across channels.
- Forethought: Offers AI-driven ticket triage and response suggestions.
- Dixa: Integrates AI for multichannel support and task automation.
- Decagon: Handles complex customer queries end-to-end using AI.
These tools help reduce manual workload and improve response time.
5. How do customer service tools compare in terms of features and effectiveness?
Customer support tools vary based on functionality:
- Help Desks focus on ticket management and multichannel support.
- CRMs manage customer relationships and sales pipelines.
- Live Chat tools provide real-time communication.
- Knowledge Bases offer self-service resources.
- AI Tools automate repetitive tasks and enhance efficiency.
The choice depends on specific business needs, team size, and customer expectations. Evaluating tools based on integration capabilities, scalability, and user experience is crucial.
6. What factors should be considered when selecting the right customer service software?
Key considerations include:
- Scalability: Can the customer support tool grow with your business?
- Integration: Does it integrate with existing systems?
- User Experience: Is it intuitive for both agents and customers?
- Customization: Can it be tailored to specific workflows?
- Analytics: Does it provide actionable insights?
Assessing these factors ensures the selected software aligns with organizational goals and helps drive the necessary business outcomes.