Skip to content


Are customers satisfied with your products and services? Are they likely to make repeat purchases or also check out other competitors?
These are the questions that keep business leaders up at night, and rightly so. Today, customer expectations are sky-high, and the competition is just a click away.
This is where measuring customer satisfaction becomes crucial. It helps companies understand what they’re doing right and what they need to improve on.
Now the important question is: How do you effectively measure this critical metric?
There are different ways to do it – from asking customers to rate their experience to filling out their satisfaction survey form. Each method can tell you something different about how your customers feel.
In this blog, we’ll look at seven ways to measure customer satisfaction. By using these methods, you can figure out how different customers perceive your business.
Table of Contents
- What is Customer Satisfaction?
- Importance of Measuring Customer Satisfaction
- 7 Ways to Measure Customer Satisfaction
- Step-by-step guide to creating Customer Satisfaction surveys
- 6 Types of Customer Satisfaction Tools
- Hiver as a Customer Satisfaction Tool
What is Customer Satisfaction?
Customer satisfaction is a measure of how well a company’s products, services, and overall customer experience meet or exceed customer expectations. It is a key performance indicator that reflects a company’s ability to deliver value to its customers consistently.
Customer satisfaction is typically assessed through surveys, ratings, and other feedback mechanisms.
Importance of Measuring Customer Satisfaction
Measuring customer satisfaction is crucial for any business seeking long-term success. Here’s why it holds immense importance:

- Cost-effective: Studies indicate acquiring a new customer can be five to seven times costlier than retaining an existing one. Prioritizing satisfaction ensures customers keep coming back, reducing acquisition expenses.
- Targeted Improvements: By understanding what customers like and don’t like, businesses can tailor their offerings and services to better meet expectations.
- Reduced Churn: Identifying areas of dissatisfaction allows businesses to address issues proactively, reducing customer churn.
- Positive Word-of-mouth: Happy customers are more likely to recommend a brand to others, generating positive word-of-mouth promotion and attracting new customers.
- Data-Driven Decisions: Customer satisfaction metrics provide valuable data to pinpoint areas where a business excels and where improvements are needed.
7 Ways to Measure Customer Satisfaction
Here are seven different to effectively measure customer satisfaction.
1. Customer Surveys
Customer surveys are one of the most direct and effective methods for measuring satisfaction. They allow your businesses to collect feedback directly from customers about their experiences with your products, services, and post-sales support.
Use metrics like Net Promoter Score (NPS), Customer Satisfaction Score (CSAT), and Customer Effort Score (CES) as part of your survey to quantify satisfaction.

✅ NPS is calculated by asking customers how likely they are to recommend your service or product on a scale of 0-10 and categorizing responses into Promoters (9-10), Passives (7-8), and Detractors (0-6).

✅ CSAT measures satisfaction with a specific transaction or interaction. You ask customers, “How satisfied were you with [experience/service/product]?” on a scale of 1-5. The score is the average of responses. As per Hiver’s benchmark survey, CSAT is the most critical metric for 41% of customer support teams.

✅ CES assesses the effort required to use a product or service or contact customer support. Ask customers, “How easy was it for you to do [action].” 1 represents very easy 5/10 represents very difficult. The score is calculated similarly to CSAT, reflecting the ease of experience.

2. Social Media Monitoring and Analysis
Monitoring and analyzing social media interactions can provide real-time insights into how customers feel about your brand, products, or services. This method involves tracking mentions, comments, and general sentiment across platforms like Twitter, Facebook, Instagram, and LinkedIn.
A. Setting Up for Social ListeningSocial Media Monitoring and Analysis
- Identify Relevant Platforms: Determine where your customers are most active. B2C companies might find more value in Facebook and Instagram, while B2B companies could lean towards LinkedIn and Twitter.
- Use Social Listening Tools: Tools like Hootsuite, Sprout Social, and Mention can track brand mentions, keywords, and industry trends across multiple platforms. These tools can aggregate data in real time, allowing for immediate analysis and response.
- Define Keywords and Hashtags: Beyond tracking brand mentions, keep an eye on campaign hashtags, relevant keywords, and even common misspellings. This ensures you capture a broad spectrum of relevant conversations.

B. Analyzing the Data:
- Sentiment Analysis: Many social listening tools offer sentiment analysis, categorizing mentions as positive, neutral, or negative. This can help you gauge overall sentiment towards your brand or specific products.
- Volume of Mentions: A sudden spike in mentions can indicate a surge in interest or a potential issue. Monitoring these changes can help you respond proactively.
- Engagement Analysis: Look at the types of posts that generate the most engagement (likes, shares, comments). This can inform your content strategy and help you create more of what your audience appreciates.
C. Actionable Insights:
- Respond to Feedback: Engage with customers who leave feedback, whether positive or negative. This shows your brand values customer input and is committed to improving. For instance, Airbnb has been proactive in addressing customer complaints by offering refunds, rebooking assistance, and even compensation when experiences don’t meet expectations.
- Identify Advocates and Influencers: Customers who frequently mention your brand in a positive light can be potential advocates or influencers. Therefore, partnering with influencers and engaging with brand advocates can help amplify your brand’s message.
- Spot Trends and Issues: Social listening can reveal emerging trends or issues with your product or service. This allows you to address problems quickly or capitalize on emerging trends.
D. Implementing Changes:
- Product Development: Use customer feedback to inform product updates or new features. For example, if customers frequently request a feature on social media, consider adding it to your development roadmap.
- Customer Service Training: Using negative feedback from social media, companies can train their customer service teams how to do better. They look at the complaints, learn what needs to be fixed, and practice with examples from real life.
- Marketing Strategy Adjustment: Positive reactions to a particular campaign can guide future marketing efforts, while negative reactions can indicate strategies that should be revised or abandoned.
3. Customer Interviews
This method involves directly talking to your customers to understand their experiences, expectations, and perceptions of your brand, product, or service. Here’s how you can do it:
- Select Participants: Choose a diverse mix of customers for interviews, including those who have had both positive and negative experiences. This diversity ensures a well-rounded understanding of customer satisfaction.
- Schedule Interviews: Reach out to selected customers via email or phone, explaining the purpose of the interview and how their feedback will be used. Provide flexible scheduling options and consider offering an incentive for their time, such as a discount or gift card.
- Prepare Your Questions: Develop a set of open-ended questions that encourage detailed responses. Avoid yes/no questions. Instead, focus on ‘how’, ‘what’, and ‘why’ questions to elicit comprehensive insights.
Some examples of questions:
“What was your initial impression of our product/service?””Can you describe a recent experience you had with our customer service team?””What changes or improvements would make your experience better?”
- Conduct the Interviews: Whether the interview is in person, over the phone, or via video call, ensure the setting is conducive to an open and honest conversation. Start with some light, general questions to build rapport.
- Review the Recordings: After conducting multiple interviews, review the recordings or notes to identify common themes or issues. Based on the feedback, prioritize changes that will have the most significant impact on customer satisfaction.
After reviewing customer interview recordings, key takeaways might include:
– Slow Response Times: Many customers are unhappy with how long it takes to get a response.
– Product Usability Issues: Some customers find parts of the product hard to use or confusing.
– Request for Live Chat: A frequent suggestion is adding a live chat feature for quicker help.
– Prioritized Changes: Speed up response times, improve product usability, and introduce a live chat feature.
4. Churn Rate Analysis
Churn rate, a critical metric for any business, measures the percentage of customers who stop using your product or service over a specific period. It’s a direct indicator of customer satisfaction and loyalty, as higher churn rates often signal dissatisfaction.
A. Calculate Churn Rate:
The simplest way to calculate the churn rate is by dividing the number of customers lost during a period by the number of customers at the start of that period. Multiply the result by 100 to get a percentage.
Let’s consider an example of a streaming service:
A streaming service had 100,000 subscribers at the start of the quarter. By the end of the quarter, 5,000 subscribers had cancelled their subscriptions.

After updating the content library, personalizing communication, and introducing a content request feature, the service aimed to reduce churn. In the following quarter, with the same starting number of subscribers, only 3,000 subscribers cancelled.

The streaming service reduced the churn rate from 5% to 3%, indicating improved customer satisfaction and retention.
B. Strategies to Reduce Churn:
- Use customer data to personalize communications and offers, making customers feel valued and understood.
- Ensure your support team is responsive, empathetic, and effective in solving customer problems. Quick and satisfactory resolutions can significantly impact customer retention.
- Implement loyalty programs that reward customers for staying with your brand. These can include discounts, exclusive content, or early access to new products.
- Address common issues and pain points identified through churn analysis. Inform customers about improvements to demonstrate your commitment to their satisfaction.
For example, a streaming service addressed customer churn by doubling its content library and introducing flexible pricing models. They also upgraded their technology to improve streaming quality, directly addressing the main reasons customers were leaving.
5. IVR Surveys
Interactive Voice Response (IVR) surveys are a tool used by businesses to measure customer satisfaction by collecting feedback directly over the phone. When a customer interacts with a service or support center via phone, they can be invited to participate in a survey at the end of their call.
One advantage of IVR surveys is that they can provide a level of anonymity, making customers more likely to give honest feedback. Since there’s no human on the other end of the line, customers might feel more comfortable sharing their true feelings about the product or service.
Here’s how it works:
- Call Completion: After a customer finishes their call with a customer service representative, instead of just ending the call, the system asks if they would be willing to take a short survey to provide feedback on their experience.
- Survey Initiation: If the customer agrees, the IVR system then guides them through a series of questions. These questions are usually designed to be answered with simple commands, like by pressing a number on their phone keypad to rate their satisfaction level (for example, pressing 1 for “very satisfied” and 5 for “very dissatisfied”).
- Question Design: The questions in an IVR survey are carefully crafted to measure specific aspects of customer satisfaction, such as the quality of service received and the helpfulness of the staff.
- Actionable Insights: Finally, the insights gained from IVR surveys may lead to actionable changes within the company. Whether it’s training staff to be more effective in their customer interactions, tweaking the product based on direct customer feedback, or improving the overall customer service process, these surveys can drive significant improvements in customer satisfaction.
6. SMS (Short Message Service) Feedback
SMS feedback is a direct and efficient method for measuring customer satisfaction. This approach involves sending short, targeted SMS messages to customers, asking them to rate their experience or answer a brief set of questions about their satisfaction.
For instance, a fast-food chain launches a new burger and seeks customer feedback via SMS. Customers who’ve opted in and bought the burger are texted to rate their satisfaction on a scale of 1-5. Observing lower ratings, the chain investigates further and learns the sauce is too spicy for their audience. They modify the recipe and text those who responded, offering a discount to sample the improved burger.
Here’s how to gauge customer satisfaction via SMS.
- Obtain Consent: Ensure you have explicit consent from customers to send them SMS messages. This is not only a legal requirement in many jurisdictions but also a best practice in respecting customer preferences.
- Create Concise Messages: SMS messages need to be short due to character limits. Craft messages that are clear and to the point, such as “How would you rate our service today on a scale of 1-5? Reply with your rating.”
- Personalize SMS: Use the customer’s name and reference-specific interactions (“Hi [Name], how was your experience with [Product/Service] today?”) to make the message feel more personal and increase the likelihood of a response.
- Send the SMS: Send SMS requests at a time when customers are most likely to respond, typically soon after a purchase or interaction with your service. Avoid early mornings or late evenings to respect your customers’ time.
- Simplify the Response Process: Make it easy for customers to respond by asking yes/no questions or using a simple numeric scale for ratings. Consider including a link to a mobile-friendly survey for more detailed feedback, but keep the initial ask as straightforward as possible.
- Aggregate Insights: Combine SMS feedback with data from other channels to get a comprehensive view of customer satisfaction. Use these insights to inform product development, customer service training, and other strategic decisions.
7. Live Chat Feedback
Live chat has become an indispensable tool for real-time customer support and engagement. It also serves as a powerful channel for measuring customer satisfaction by enabling your support team to directly interact with customers while they are having an experience with your business. This method allows for immediate feedback and the ability to address concerns or questions on the spot.
Implementing Live Chat for Measuring Customer Satisfaction:
- Choose the Right Live Chat Software: Select a live chat solution that integrates seamlessly with your website and offers features like automated greetings, chat history, and satisfaction surveys post-chat.
- Train Your Team: Ensure your live chat representatives are well-trained not only in customer service skills but also in how to encourage feedback during or after the interaction. They should know how to handle both positive and negative feedback constructively.
- Set Up Automated Triggers: Use automated triggers for live chat to engage customers at critical moments, such as when they spend a long time on a checkout page or FAQ section. This proactive approach can help identify and resolve issues before they escalate.
- Encourage Immediate Feedback: At the end of each chat session, prompt users to rate their satisfaction with the interaction. Keep it simple, such as a thumbs up/down rating or a 1-5 scale rating, to encourage participation.
- Review Chat Transcripts: Regularly review chat transcripts to identify common questions, concerns, or points of friction. Look for patterns that might indicate broader issues with your product or service.
Step-by-step guide to creating Customer Satisfaction surveys
Here are steps to effectively measure customer satisfaction:
1. Define Your Objective
Understand why you’re measuring customer satisfaction. Is it to improve product quality, customer service, or overall experience? Next, determine which customers you want to survey. This could be new customers, repeat customers, or customers who have made a significant purchase.
2. Select the Method of Collection
Decide how you will collect customer feedback. Common methods include:
- Surveys: Via email, SMS, or embedded on your website.
- Interviews: One-on-one conversations that provide deep insights.
- Feedback Widgets: On your website or app, allow customers to give feedback at their convenience.
- Social Media and Online Reviews: Monitor mentions of your brand and reviews on platforms like Yelp, Google, and social media sites.
3. Design Your Survey/Feedback Tools
- Question Types: Use a mix of question types, including multiple-choice for quantitative data and open-ended questions for qualitative insights. Rating scales (e.g., 1 to 5 or 1 to 10) are useful for measuring degrees of satisfaction, while binary yes/no questions can simplify analysis.
- Keep It Short: Lengthy surveys may deter customers from completing them. As per HubSpot, the ideal survey length is 10-14 minutes, for 7-10 survey questions.
4. Implement Your Survey
- Choose the Right Time: Timing can significantly affect response rates. Avoid sending surveys during holidays or outside of normal business hours.You can survey your customers either month, quarterly, or yearly.
- Personalize the Approach: Personalized invitations to surveys can increase response rates.
- Incentivize Participation: Offering a small reward can motivate customers to complete your survey.
5. Analyze the Data
- Quantitative Analysis: Use statistical tools to analyze numerical data from CSAT, NPS, and CES scores.
- Qualitative Analysis: Read through open-ended responses to identify common themes and insights.
- Segment the Data: Look at responses based on different customer segments (e.g., new vs. returning customers).
6. Act on the Feedback
Use the feedback to pinpoint areas needing attention. Implement changes based on customer feedback to improve products, services, or processes. Follow up with customers who provided feedback, especially those who reported dissatisfaction, to let them know how their input has led to changes.
6 Types of Customer Satisfaction Tools
Various tools and software solutions can help businesses track, measure, and improve customer satisfaction. Here’s an overview of some popular types of customer satisfaction tools:
- SurveyMonkey: A versatile online survey tool that allows businesses to create, send, and analyze surveys to gauge customer satisfaction. It offers various question types and templates specifically designed for customer feedback.
- Google Forms: A free tool that can be used for creating simple surveys. It’s integrated with Google Drive, making it easy to organize and analyze responses.
- Typeform: Known for its user-friendly interface and design, Typeform offers engaging surveys that can help improve response rates. It’s particularly good for creating interactive and personalized surveys.
- Qualtrics CustomerXM: A powerful tool that provides insights into customer expectations, preferences, and aversions. It’s designed to help businesses improve the customer experience at every touchpoint.
- Delighted: Allows businesses to quickly survey their customers to measure satisfaction and loyalty using the Net Promoter System. It’s easy to set up and can automate the process of collecting and analyzing NPS data.
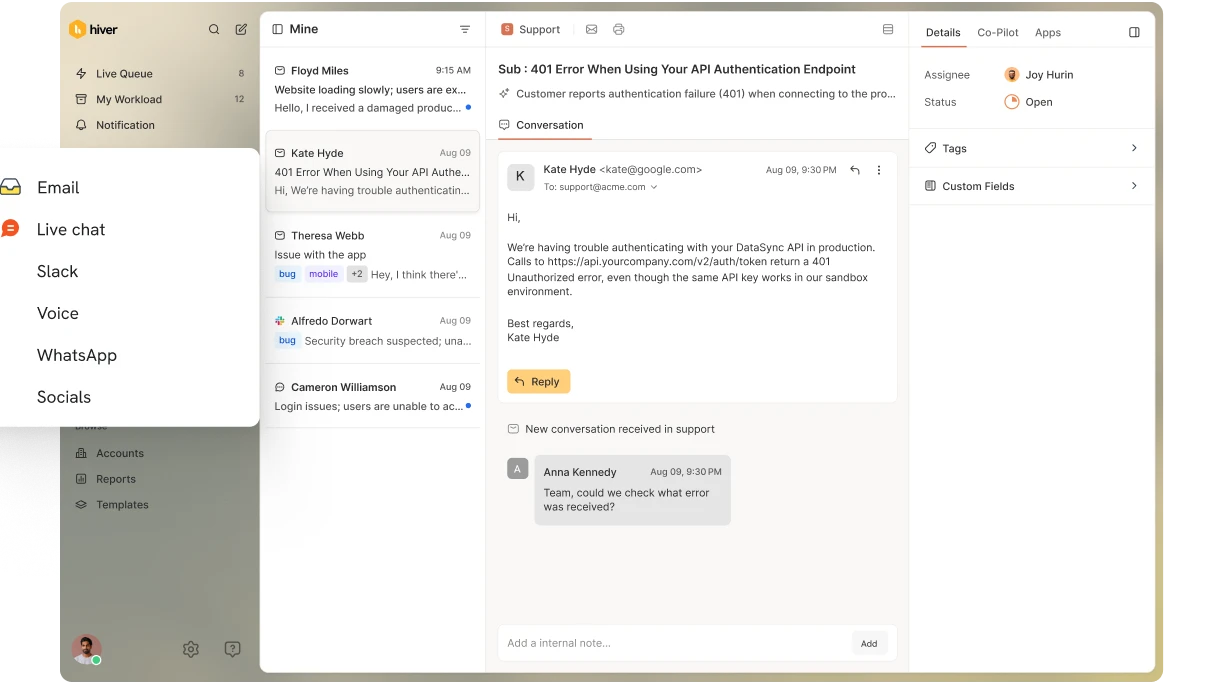
Hiver as a Customer Satisfaction Tool
Hiver is a powerful Gmail-based customer service software. Here’s how it helps collect customer feedback.
- Instant CSAT Surveys: Hiver enables the inclusion of Customer Satisfaction Score (CSAT) surveys at the end of every email interaction. This feature allows for the immediate collection of customer feedback, providing real-time insights into customer satisfaction levels.
- Customizable Surveys: Tailor survey questions to align with specific business needs, enabling more relevant and actionable customer feedback.
- CSAT Reports: Access detailed reports on customer satisfaction metrics, offering insights into the effectiveness of customer service efforts, identifying areas for improvement, and tracking team performance over time.

Get started with Hiver. Free for 7 days