Quick Summary
The best customer support software in 2026 balances AI that actually resolves complex tickets with pricing that doesn’t spike once your automation starts working. Hiver leads for complex B2B support, Zendesk for enterprise routing, and Zoho Desk for small teams on a tight budget.
| # | Software | Best For |
| 1 | Hiver | Complex B2B support with AI included in every plan |
| 2 | Zendesk | Enterprise teams needing deep routing and customization |
| 3 | Zoho Desk | Small, cost-conscious teams that want a real free plan |
Customers Have Little Patience Left for Bad Support
According to a Hiver survey, 72% of customers switch brands after just one poor support experience, and over half expect resolution within 24 hours. That leaves support teams almost no margin for error, and no team can hit that bar without the right software behind it.
Modern customer support software does more than close tickets. The best platforms route requests, surface full customer context, and increasingly use AI to resolve routine issues on their own, freeing agents for the ones that actually need a person.
This guide ranks the 10 best customer support software platforms for 2026, with real pricing, honest pros and cons, and what each one is actually built for.
Why Listen to Us
Hiver powers email support for 10,000+ customer service, finance, and HR teams worldwide, including Flexport, Ping Identity, Gusto, and Epic Games, who’ve resolved 484 million+ requests on the platform. We hold a 4.6-star G2 rating, and we evaluated every platform here on setup effort, feature depth, AI capability and pricing, and total cost, verified July 2026.

What Is Customer Support Software?
Customer support software is any platform that helps a team manage, track, and resolve customer issues across channels like email, live chat, phone, and social media. As a company grows, a manageable inbox can quickly become scattered tickets across five tools.
That’s where a help desk ticketing system comes in, centralizing conversations and surfacing full customer context. Increasingly, AI drafts replies, summarizes threads, and resolves routine requests without an agent touching them.
10 Best Customer Support Software at a Glance
We’ve done the groundwork for you — here’s a round-up of our top customer service tools:
| # | Software | Best For | Standout Feature | Free Plan | G2 Rating |
| 1 | Hiver | Complex B2B support | AI included in every plan | Yes | 4.6 |
| 2 | Zendesk | Enterprise routing and customization | Deepest integration marketplace in the category | No | 4.3 |
| 3 | Freshdesk | Scaling omnichannel support | Collision detection and shared ticket ownership | Limited (6 months) | 4.4 |
| 4 | Zoho Desk | Cost-conscious small teams | Sentiment-aware triage on a small budget | Yes | 4.4 |
| 5 | Salesforce Service Cloud | Enterprise teams already on Salesforce | Full CRM context tied to every case | Limited (2 users) | 4.4 |
| 6 | HubSpot Service Hub | Teams unifying support with sales and marketing | Native tie-in to the HubSpot CRM | Limited (2 users) | 4.4 |
| 7 | Intercom (now known as Fin) | AI-first, messenger-led support | Fin AI Agent, one of the strongest on the market | No | 4.5 |
| 8 | Front | Collaboration-heavy support teams | Shared drafts and full team visibility | No | 4.7 |
| 9 | Tidio | Chat-first small sites and SMBs | Live chat widget with the Lyro AI add-on | Yes | 4.7 |
| 10 | Gorgias | Shopify and ecommerce brands | Native order, refund, and subscription actions | No | 4.6 |
Best Customer Support Software for Complex B2B Support
1. Hiver
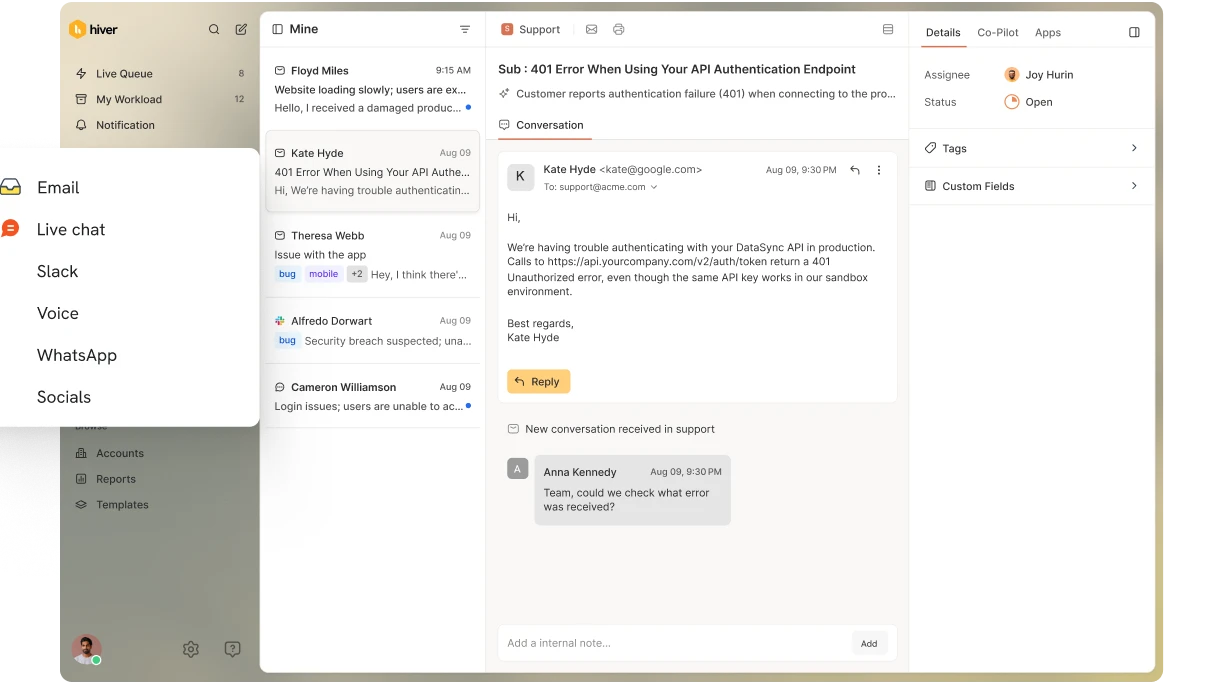
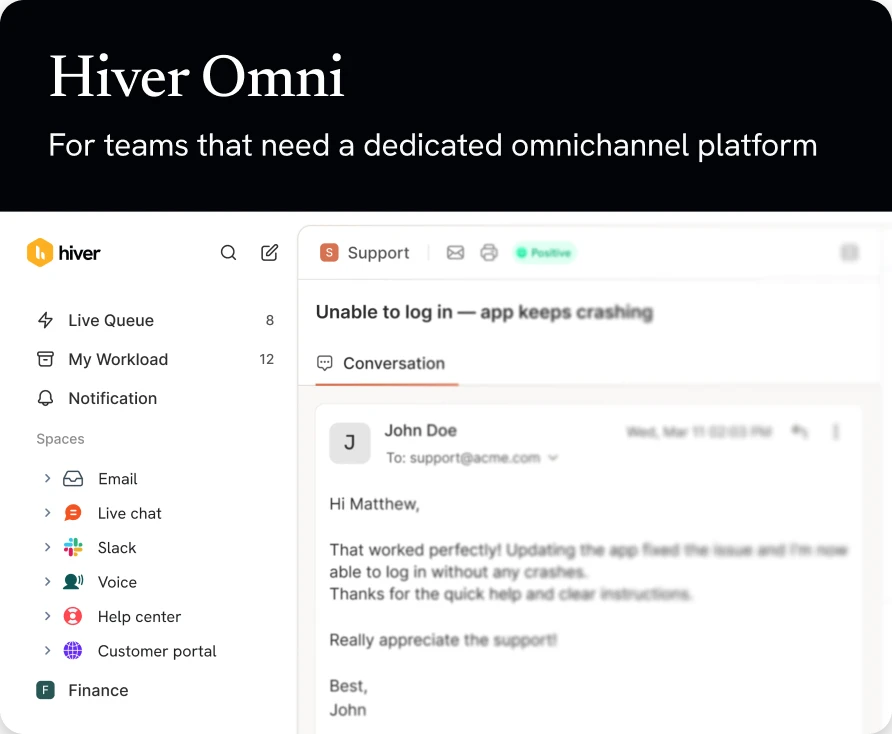
Hiver is an agentic shared inbox platform built for complex email support. It turns emails in shared addresses like support@ or billing@ into structured conversations with a clear owner and status. It also has built-in ticketing features like SLAs, ticket management workflows, custom fields, and more. Escalations and handoffs stay visible to the whole team, with Slack collaboration built right in and full context pulled from your CRM, ERP, and order management systems.
Flexport’s freight operations team runs high-volume threads where one shipment question can involve carriers, customs, and the customer at once. After moving to Hiver, the team resolved emails 50% faster. “We have much better visibility across support conversations. Trying to achieve this level of collaboration without it would be impossible,” says Nathan Strang, Ocean Freight Operations Manager at Flexport.
Key Features
- AI Agents: resolve routine tickets end to end, reading tone and pulling ticket details.
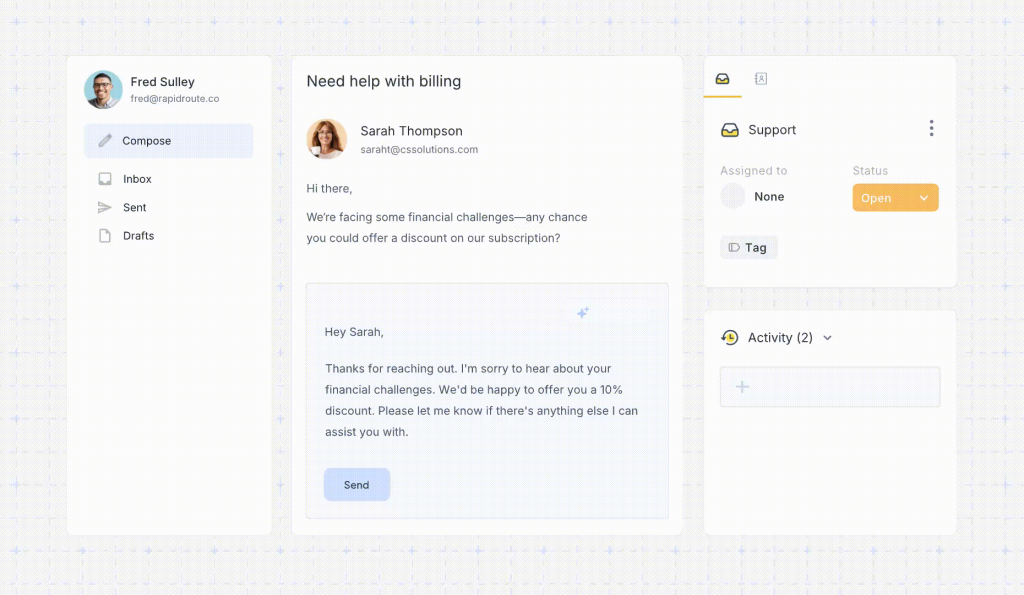
- AI Copilot: drafts replies and summarizes threads on harder tickets.
- AI Insights: shows performance trends and sentiment.
- Ticketing: trackable tickets with SLA tracking and automations.
- Integrations: two-way sync with Slack, Asana, Jira, and Salesforce.
Pricing
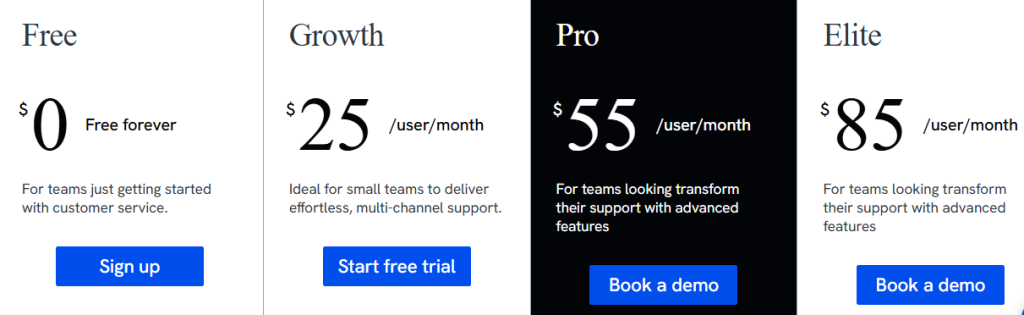
- Free: $0, free forever, with Shared Inbox basics and no agent limits
- Growth: $25 per user/month
- Pro: $55 per user/month
- Elite: $85 per user/month
- AI is included in plans rather than metered, and there’s a 7-day free trial
Pros
- AI included in every plan, so costs stay predictable as automation scales
- Built for complex, multi-step tickets that need input from teams outside support
- Most teams are running in under 15 minutes, without a dedicated admin
- No agent limits, even on the free plan
Cons
- Optimized for B2B support workflows, with the strongest experience in shared inbox and digital support.
Best Customer Support Software for Enterprise Teams
2. Zendesk

Zendesk is the market leader in customer support software, and a popular choice among large teams running multiple support channels. Setting up and using the platform isn’t straightforward, though. Most teams need a dedicated admin to configure and maintain it, and many Zendesk customers end up paying for AI capability they never fully implement.
Key Features
- Agent Workspace: email, chat, messaging, and calls in one view with full history.
- AI routing: sorts tickets by intent, language, and sentiment.
- AI QA and workforce management: quality monitoring plus forecasting and scheduling.
- Integration marketplace: one of the largest in the category.
Pricing
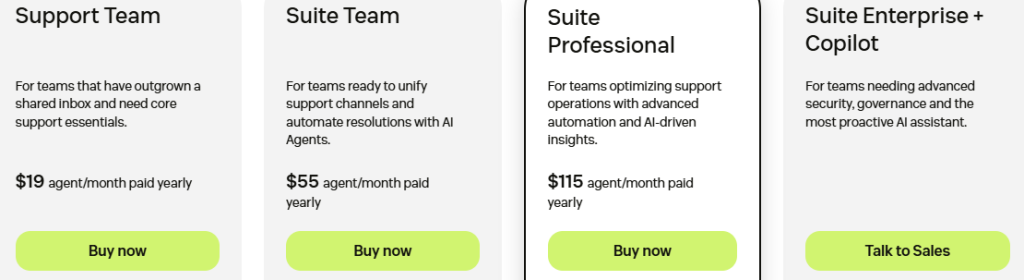
- Support: from $19/agent/month, email and ticketing only
- Suite: $55 to $115+/agent/month
- AI resolutions bill at roughly $1.50 to $2.00, overages automatic
- Copilot add-on: $50/agent/month. 14-day trial, no free plan
Pros
- Deepest routing, customization, and enterprise governance in the category
- Massive marketplace of prebuilt integrations
- Mature AI QA and workforce management tooling
Cons
- Complex setup with a real learning curve, plan for a dedicated admin
- AI bills per resolution above a small allowance, with auto-charged overages
3. Salesforce Service Cloud

Salesforce Service Cloud is the customer-service arm of the broader Salesforce platform, built around the same CRM data as its sales and marketing products. Every case comes with a full 360-degree view of the customer, pulled from wherever else in Salesforce that customer shows up. For teams already running Salesforce, that context is hard to replicate elsewhere. For everyone else, it’s a heavier lift than a dedicated support platform.
Key Features
- Case management: omnichannel routing tied to the Salesforce CRM record.
- Agentforce: Salesforce’s AI layer handles requests independently on higher tiers.
- Deep customization: workflow automation, approvals, enterprise reporting.
- Native integration: connects with Sales Cloud and Marketing Cloud.
Pricing

- Starter Suite $25 / Pro Suite $100 / Enterprise $175 (AI unlocks here) / Unlimited $350 / Agentforce 1 Service $550, per user/month
Pros
- Unmatched depth for teams already invested in the Salesforce ecosystem
- Powerful customization and enterprise-grade automation
- Full customer context across sales, marketing, and service in one record
Cons
- AI doesn’t unlock until the $175 Enterprise tier, so the cheap “Suites” are CRM bundles, not a full service desk
- Agentforce usage is billed separately and isn’t easy to forecast from the pricing page
Best Customer Support Software for Scaling and Growing Teams
4. Freshdesk

Freshdesk’s customer support software is amongst the most sophisticated in the industry, and it scales from a small team to serious multi-channel volume. According to several users, setting up its advanced features can be challenging, often requiring extra training. Its most useful AI capabilities are also sold as paid add-ons. In comparison, Hiver includes AI capabilities natively within its plans.
Key Features
- Collision detection: see who’s already on a ticket, share ownership on higher tiers.
- Freddy AI: automates tasks and drafts responses, sold as add-ons.
- Self-service: a portal and knowledge base with FAQs.
- Gamification: turns tasks into challenges with points and leaderboards.
Pricing

- Growth: $19 / Pro: $55 / Enterprise: $89 per agent/month
- Freddy AI Copilot: ~$29/agent/month, Pro and Enterprise only
- Freddy AI Agent: $49 per 100 sessions past allowance. 14-day trial
Pros
- Scales well from small team to serious volume
- Collision detection and shared ownership built for busy queues
- Broad omnichannel coverage via the Freshdesk Omni line
Cons
- Advanced feature setup is genuinely difficult without help
- AI is sold as add-ons, per-agent Copilot plus per-session Agent pack
5. HubSpot Service Hub
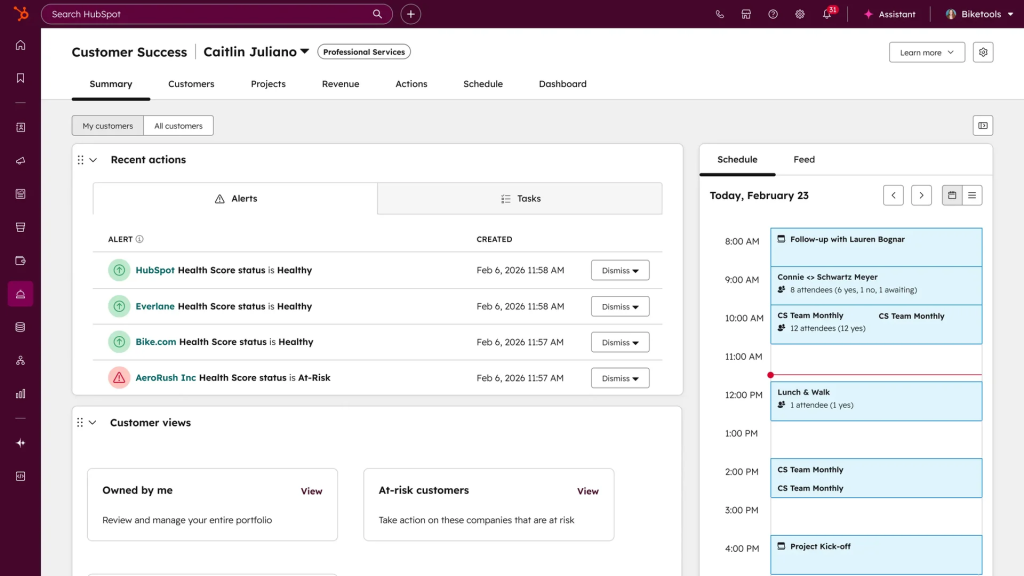
HubSpot Service Hub is the support component of the broader HubSpot platform, built on top of its free CRM. Its main strength is tying support directly to marketing and sales data, so an agent sees a customer’s full history, not just their tickets. That integration is the whole pitch, and it’s also the catch: Service Hub is priced and positioned as a layer of HubSpot, not a standalone helpdesk, so the real cost depends on how much of the rest of HubSpot you’re already running.
Key Features
- Help Desk Workspace: ticketing, shared inbox, live chat, and chatbots on the CRM record.
- Self-service: knowledge base, customer portal, and feedback surveys.
- Breeze Customer Agent: HubSpot’s AI layer, from Professional up.
- Native integration: ties to Marketing, Sales, CMS, and Operations Hubs.
Pricing

- Free: $0/month, up to 2 users
- Starter: from $7/seat/month (list $20), 500 credits
- Professional: from $90/seat/month (list $100), 3,000 credits
- Enterprise: from $150/seat/month
Pros
- Tight integration with the broader HubSpot ecosystem
- Useful free tools and an accessible entry price
- Genuinely unifies the customer record across service, sales, and marketing
Cons
- Mandatory onboarding fees on Professional and Enterprise add thousands to the real first-year cost
- Breeze AI credits run out fast and are easy to underestimate
Best Customer Support Software for AI-First and Collaborative Teams
6. Intercom (now known as Fin)

Intercom is a customer messaging and support platform built around an AI-first approach, best known for Fin, its AI agent. Two things changed in 2026. In May, the company renamed itself Fin, and in June, Salesforce signed a definitive agreement to acquire it for roughly $3.6 billion, expected to close in late 2027. Pricing hasn’t changed, but on a multi-year contract, the roadmap will eventually sit inside Salesforce.
Key Features
- Three ticket types: Customer, Back-office, and Tracker Tickets for different workflows.
- Fin AI Agent: learns your tone, supports 45+ languages, hands off complex issues.
- Customer portal: buyers track and manage their own tickets.
- Side conversations: loop in partners without losing context.
Pricing
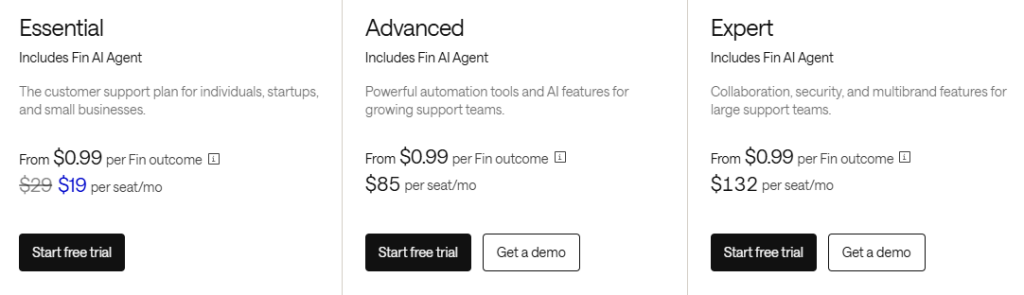
- Essential $19 (list $29) / Advanced $85 / Expert $132 per seat/month
- Fin AI: $0.99 per outcome, on top of seats. 14-day trial
Pros
- One of the most capable autonomous AI agents on the market
- Thoughtful ticket architecture for coordinating internal and customer-facing work
- Strong in-app and messenger-first support experience
Cons
- Add-ons and channels push the real price well past the $29 headline
- Pending Salesforce acquisition adds roadmap uncertainty for long-term contracts
7. Front

Front is a shared inbox solution built for teams that work and collaborate out of a common mailbox, and it’s known for encouraging a highly collaborative work environment. Many users raise concerns about its pricing. The plan lineup changed completely in 2026, some basic features sit on higher-priced plans, and AI is gated behind paid add-ons. Hiver bakes AI capabilities into its base plans at no added cost.
Key Features
- Universal inbox: email, social, and live chat in one queue.
- Shared drafts: colleagues co-write one reply with full visibility.
- AI toolkit: Compose drafts, Summarize condenses, Answers runs live chat.
- Workflow automation: rules and macros that deepen with each tier.
Pricing

- Starter: $25/seat/month, one channel, caps at 10 seats
- Professional: $65/seat/month, caps at 50. Enterprise: $105/seat/month
- AI add-ons: Copilot/Smart QA ~$20/seat/month, Autopilot ~$0.89/resolution
- 14-day trial, no free plan
Pros
- Best-in-class collaboration mechanics: shared drafts, comments, visibility
- Clean, familiar inbox experience that teams adopt quickly
- Solid multi-channel coverage on Professional and above
Cons
- AI features stack as per-seat add-ons, with Autopilot metered per resolution
- Seat caps on Starter (10) and Professional (50) force tier jumps
Best Customer Support Software for Small Teams and Budgets
8. Zoho Desk
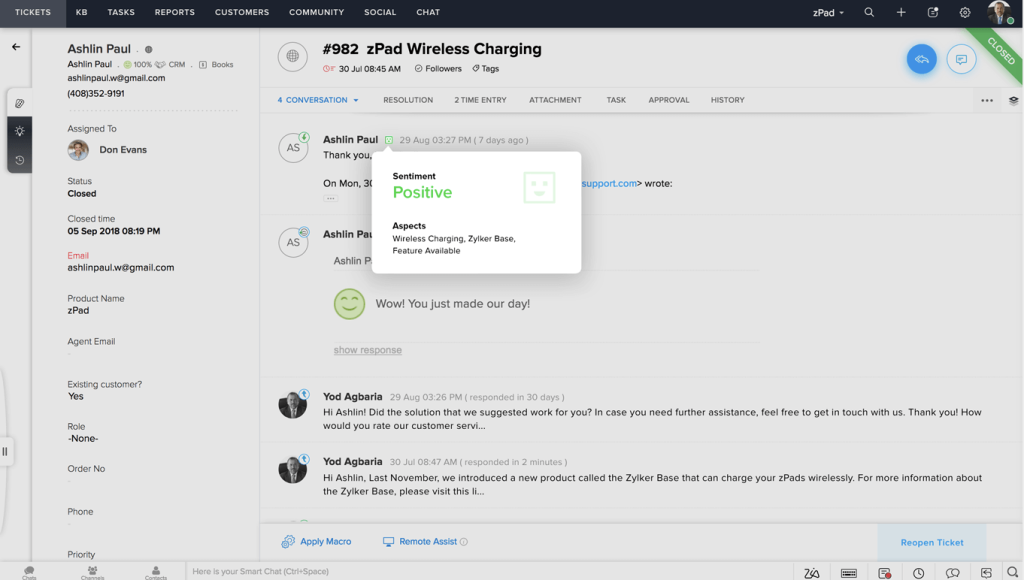
Zoho Desk is a budget-friendly helpdesk from the Zoho suite, with a forever-free plan and one of the lowest entry prices in the category. It’s a natural choice for teams already running Zoho products like Zoho CRM. According to some users, integrating it with tools outside the Zoho ecosystem can get tricky.
Key Features
- Zia AI: sentiment analysis plus response suggestions from your knowledge base.
- Automatic ticket handling: email-to-ticket with priority sorting and auto-assignment.
- Multi-channel intake: email, social, chat, web forms, and phone.
- Agent collaboration: comments, tagging, history, and templates.
Pricing
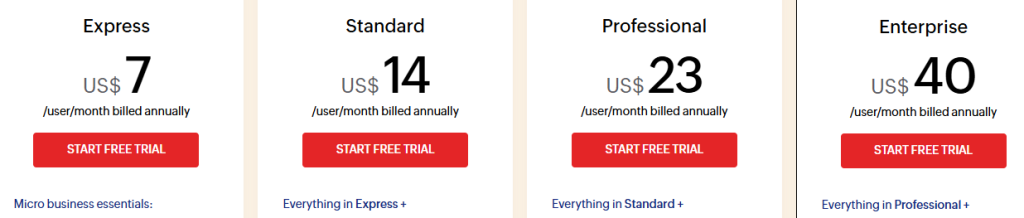
- Express: $7 / Standard: $14 / Professional: $23 / Enterprise: $40 per agent/month, billed annually
- 15-day free trial
Pros
- One of the lowest paid entry prices in the category
- Sentiment-aware triage on a small-team budget
- Tight fit with the rest of the Zoho suite, including Zoho CRM
Cons
- Integrations outside the Zoho ecosystem can get tricky to set up
- Advanced AI and channel features sit on the top tiers
Best Customer Support Software for Chat-First and Ecommerce Support
9. Tidio

Tidio is a live chat and chatbot platform that grew into a lightweight helpdesk, and it’s a common starting point for small ecommerce and SMB sites that need a chat widget on their homepage more than a full ticketing system. Its AI chatbot, Lyro, is the headline feature, but it’s gated behind an add-on on every plan except the top tier, which is where the pricing gets complicated fast.
Key Features
- Live chat widget: customizable triggers and automated greetings.
- Lyro AI Agent: answers questions using site content, sold separately.
- Flows: a visual chatbot builder for common questions.
- Shared inbox: email, chat, Instagram, and Messenger.
Pricing
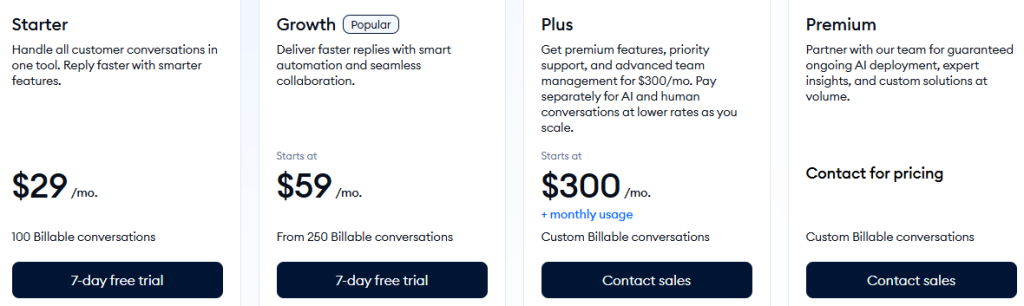
- Starter: $29/month, around 100 conversations
- Growth: $59/month, scaling conversation limits
- Plus: $300/month
- Premium: custom
Pros
- Fast to set up for a team that mainly needs a chat widget and basic automation
- Free plan is genuinely usable for very small sites
- Flows gives non-technical teams a way to automate simple, repetitive questions
Cons
- Lyro AI isn’t included on any plan under $749/month, so meaningful AI support costs extra on top of the base plan
- Built primarily for live chat and small-site support, not full ticketing or complex, multi-department workflows
10. Gorgias
Gorgias is the leading helpdesk built specifically for Shopify and ecommerce brands, with deep native actions for orders, refunds, and subscriptions built into every ticket. It prices by ticket volume instead of seats, so a store can add unlimited agents without raising the subscription cost, though ticket overages and AI resolutions both add up fast during high-volume periods like holiday sales.
Key Features
- Native Shopify actions: refund, exchange, or look up orders in a ticket.
- Bundled AI Agent: every tier includes automated interactions by default.
- Automation and macros: handle repetitive order and return questions.
- Revenue analytics: from Pro up, ties support to sales impact.
Pricing
- Starter: $40/month, 50 tickets, 30 AI interactions
- Basic: $90/month, 300 tickets. Pro: $550/month, 2,000 tickets, most popular
- Advanced: $1,430/month, 5,000 tickets, sales call required
Pros
- Deep, genuinely useful native Shopify integration most general-purpose helpdesks can’t match
- Unlimited agents on most plans, useful for stores that staff up seasonally
- Purpose-built for the exact repetitive questions ecommerce support handles most (WISMO, returns, exchanges)
Cons
- Ticket-based pricing plus per-resolution AI billing means costs can spike sharply during peak sales periods
- Double billing on AI-resolved conversations (as both a ticket and a resolution) is easy to miss when estimating cost
Other Tools That Round Out Your Support Stack
Most teams add a few adjacent tools around their platform.
Knowledge base software: Like ProProfs KB gives customers a searchable, self-service knowledge base; most platforms, Hiver included, have one natively, helping agents refer to verified solutions the way Simply Contact does. Explore knowledge management tools.
Live chat tools: LiveChat adds real-time conversations alongside your main platform. See the best live chat software.
Feedback software: SurveyMonkey captures CSAT and NPS, though most platforms have this built in. Learn how to create customer surveys.
Internal communication tools: Like Slack help agents loop in other departments, the gap Hiver’s internal notes and @mentions close without leaving the ticket. Browse internal communication tools.
Project management tools like Asana turn an escalation into a tracked task; Hiver’s Asana integration manages tasks directly from Gmail. See a guide to email project management.
How to Choose the Right Customer Support Software
Define your needs
List your current pain points, missed messages, duplicate replies, no visibility, and translate them into must-have features rather than nice-to-haves.
Map your channels and volume
Know which channels your customers actually use today and how many requests you handle, so you don’t overbuy or underbuy.
Evaluate usability and integrations
Check how intuitive the interface is for agents and admins, and confirm it connects cleanly with your CRM and other core tools.
Model the total cost, not the sticker price
Add up seats, AI usage, onboarding fees, and add-ons at your real volume before comparing platforms. This is where per-resolution AI pricing changes the math the most.
Check vendor reputation
Read recent, independent reviews on G2 or Capterra, and pay attention to patterns in the complaints, not just the star rating.
Run a real trial
Have your agents test the platform on actual tickets before you commit. A demo shows you the pitch. A trial shows you the workflow.
Bonus: What Reddit Users Are Saying About Customer Support Tools
Multichannel support (r/smallbusiness): many recommend Freshdesk and Hiver for ease of setup; others call Zendesk powerful but too complex for smaller teams.
Good free plan (r/SaaS): startups leaned toward Zoho Desk and Freshdesk, but noted limitations once teams scale.
Customer support tools (r/SaaS): founders debated all-in-one platforms like Zendesk versus simpler tools like Hiver or Front.
Email, tickets, and surveys (r/ecommerce): ecommerce folks emphasized survey features alongside ticketing, with Gorgias often mentioned as Shopify-friendly.
Our takeaway: the “big names” come up first, but when teams want something easy to adopt and genuinely collaborative, tools like Hiver tend to stand out.
Choose the Platform Built for How Support Actually Works
The right customer support software isn’t the one with the longest feature list. It’s the one that matches how your team works, and increasingly, how its AI is priced. Small teams should optimize for setup speed and honest free tiers. Enterprise teams should model AI usage costs before signing, since per-resolution and per-outcome meters at Zendesk, Salesforce, Intercom, and Front mean the invoice grows as automation improves.
If your team handles complex queries that cut across departments, with AI you want included rather than metered, Hiver is the strongest place to start. Start for free today or book a demo.
Frequently Asked Questions (FAQs)
What is customer support software?
Customer support software is a platform that helps businesses manage, track, and resolve customer issues across email, chat, phone, and social media, giving teams structure a shared inbox alone can’t provide.
What are the best customer support software platforms in 2026?
Strong options include Hiver for complex B2B support, Zendesk for enterprise routing, Salesforce and HubSpot for CRM-integrated support, Freshdesk for scaling teams, Zoho Desk for tight budgets, Fin for AI-first support, Front for collaboration, and Tidio or Gorgias for ecommerce.
What are the benefits of using customer support software?
Faster resolution through routing and AI, coverage across every channel, better internal collaboration, and clearer reporting.
Which customer support software is best for small businesses?
Hiver, Zoho Desk, and Tidio all offer genuinely usable free plans built for small teams. Freshdesk and Salesforce have limited free programs too, worth checking if your team is very small.
How does AI change the cost of customer support software?
Several major platforms, including Zendesk, Salesforce, Intercom, and Front, now bill AI separately from seats, per resolution or per outcome, so the sticker price and the real invoice can diverge sharply as automation grows. Hiver is an exception, with AI included in every plan rather than metered.
How do I choose the right customer support software for my team?
Map your channels and must-have features, model total cost at real usage rather than the headline price, check recent reviews, and run a hands-on trial before committing.