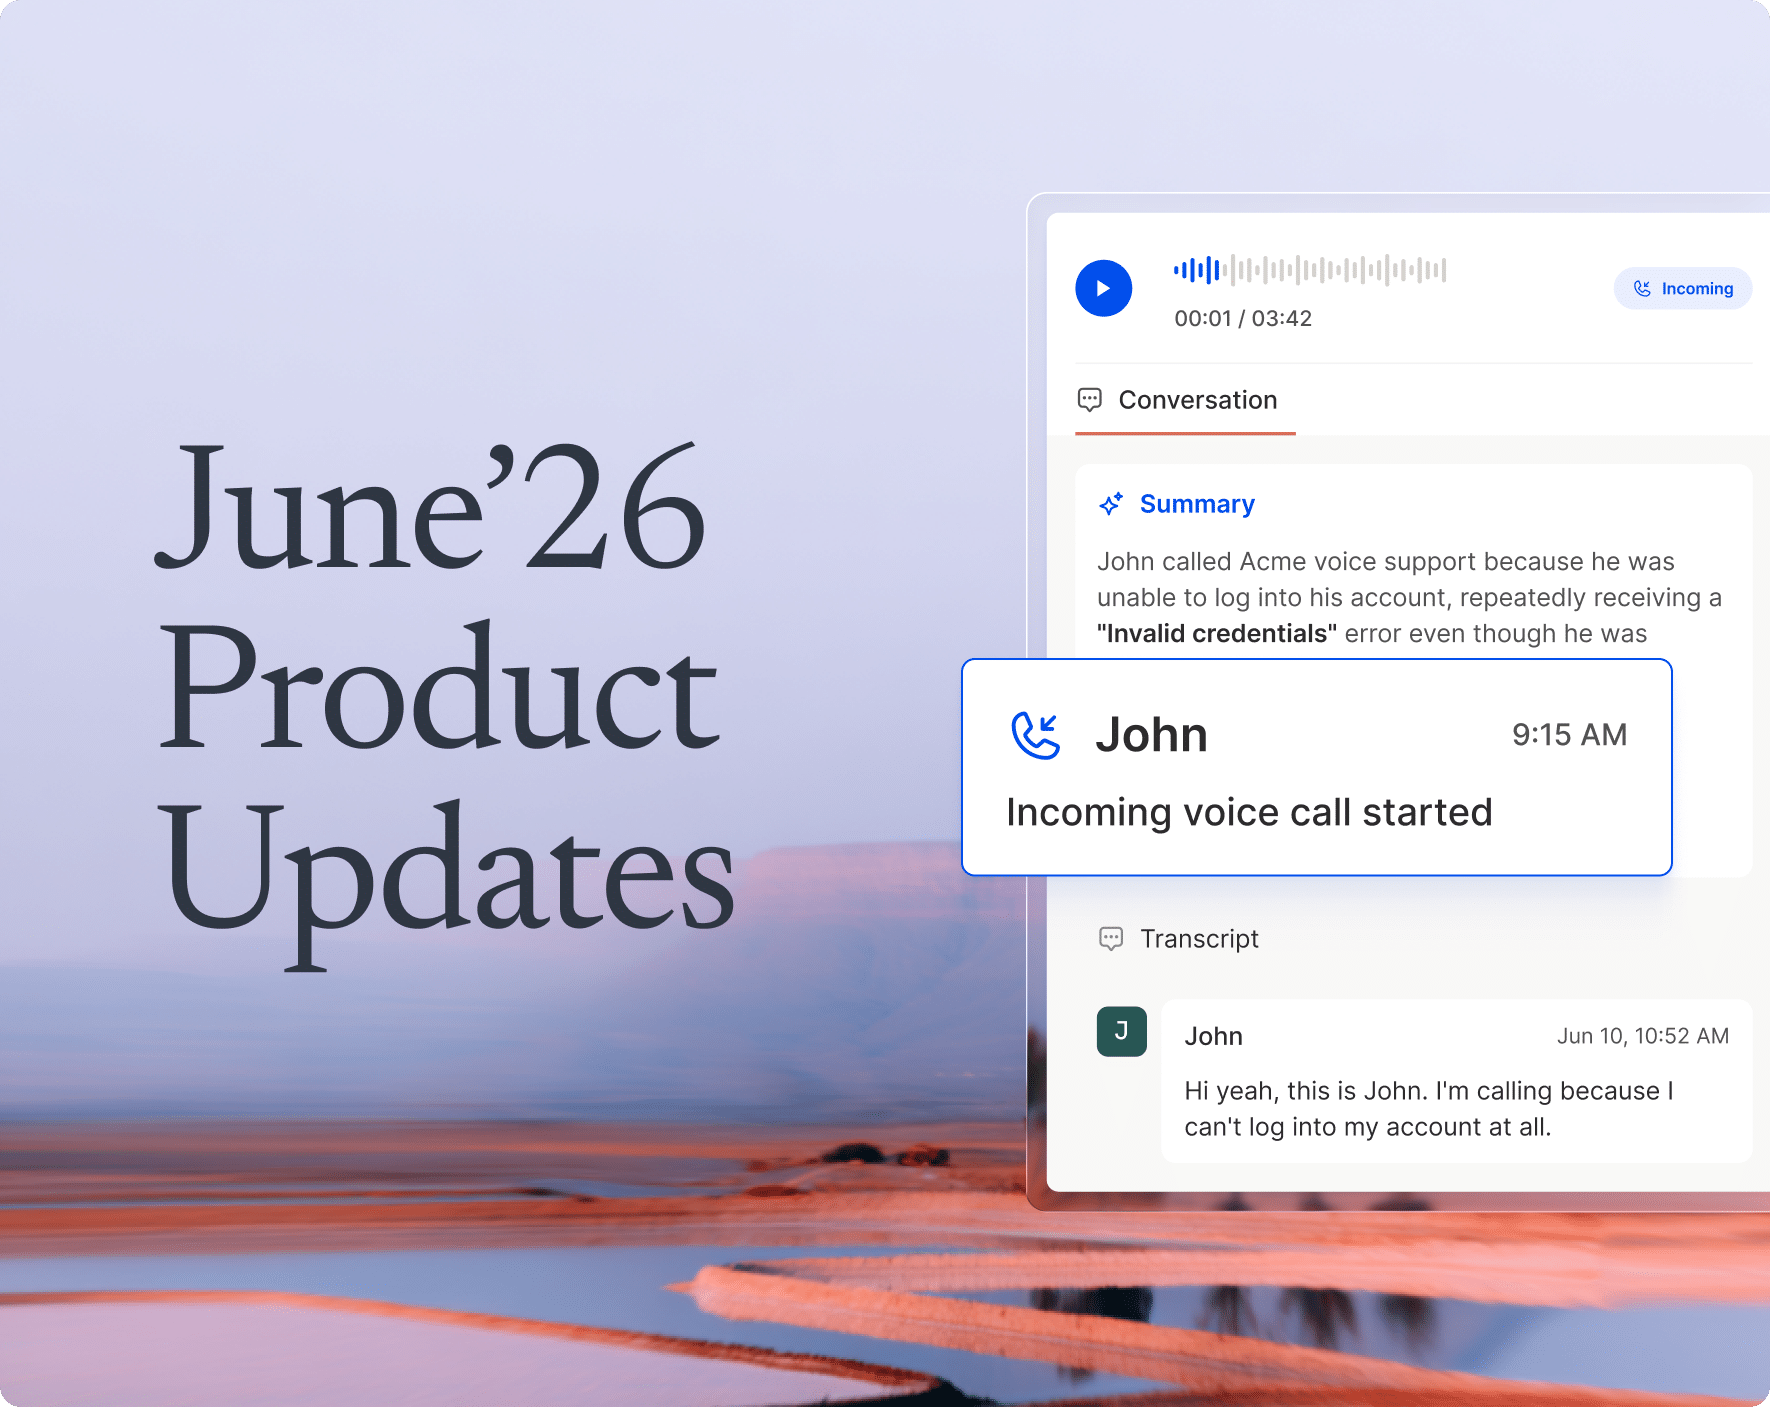
Skip to content


Most of your day runs through Outlook. You’re sending replies, chasing follow-ups, and sorting through endless threads. It feels busy, but is it really productive?
Once a message is answered, it’s gone. You don’t know how long it took to reply, how many emails went unanswered, or if someone on your team is buried under too much.
Microsoft Outlook analytics tools change that. It shows exactly how your inbox is used, including how quickly replies are sent, which hours are the busiest, and where conversations get stuck.
If you’ve ever wondered whether your team is as responsive as you think, this guide is for you. I’ll cover:
- Why Outlook Analytics Tools matter.
- The most useful email metrics to track.
- How to set it up.
- 8 tools you can start using right away.
Table of Contents
- What are Outlook Analytics Tools?
- Why Microsoft Outlook Analytics Tools Matter?
- Important Microsoft Outlook Email Metrics to Track
- 10 Microsoft Outlook Analytics Tools: Pricing & Features Compared
- 10 Top Microsoft Outlook Analytics Tools
- How to Integrate the Microsoft Outlook Analytics Tool?
- Key Features to Look for in a Microsoft Outlook Analytics Tool
- Make Microsoft Outlook Work Smarter With Analytics
- Frequently Asked Questions
What are Outlook Analytics Tools?
Outlook analytics tools are add-ons or platforms that plug into Microsoft Outlook. They track how emails are handled and turn inbox activity into usable data.
These tools go beyond the basic inbox view. They capture details like the number of emails sent and received, first response time, and the number of unresolved conversations.
These reports work like dashboards, showing patterns in Outlook email analytics. Instead of scrolling through long threads, you get numbers and visuals that make performance easier to understand.
Why Microsoft Outlook Analytics Tools Matter?
Microsoft Outlook email analytics tools do more than show numbers. They help teams work smarter and highlight trends that aren’t obvious daily. For example, email traffic always spikes on Mondays, or client conversations tend to stall after the third reply.
They also give you historical context. You can compare this month’s performance with last month’s, or check whether a new process improved response times.
And finally, these tools make performance transparent. When everyone has access to the same numbers, it’s easier to set goals, track progress, and celebrate wins as a team.
Important Microsoft Outlook Email Metrics to Track
Looking at Outlook email analytics data only makes sense if you know which numbers matter. Tracking the right metrics, such as average time, emails sent, and first response time, gives you a clear picture of how well emails are being managed and, more importantly, where you can improve.
Here are some key Microsoft Outlook metrics you need to focus on:
- Emails sent/received per day: Shows the overall volume of communication. Use this to balance workload and reassign conversations if one person handles twice the volume of others.
- Average response time: Measures how quickly emails are answered. Set internal benchmarks (e.g., all emails should be replied to within 2 hours) and monitor if your team meets them.
- Email open rates: Tracks how many recipients open your emails. Experiment with subject lines and sending times. If open rates are low, adjust until you see improvement.
- First response time: Measures how long it takes to send the very first reply. Prioritize reducing this metric, especially for customers or prospects, as it sets the tone for the entire conversation.
- Busiest times/days: Shows when the inbox is most active. Staff your team around these peaks; don’t leave the busiest times uncovered.
- Thread lengths / unresolved emails: Tracks conversations that drag on or remain unanswered. Create a rule to escalate long threads to a call or assign unresolved emails to someone directly.
Together, these metrics form the foundation of Outlook email analytics. Track them consistently, and you’ll always know whether your inbox is helping your team stay productive.
10 Microsoft Outlook Analytics Tools: Pricing & Features Compared
Choosing the right Outlook email analytics tool depends on your budget, the depth of analytics you need, and how your team uses Outlook.
Here’s a side-by-side comparison to help you see the differences quickly.
| Tool Name | Pricing Overview (Billed Annually) | Standout Feature | Best for |
|---|---|---|---|
| Hiver | -Growth: $25/user/moPro: -$45/user/moElite: -$75/user/mo | Outlook-like inbox with shared inbox, AI Copilot, SLAs, and analytics | Customer support, sales, and operations teams |
| Microsoft 365 Reports | -Included with Microsoft 365 subscriptions -Business Basic: $6 /mo -Standard: $12.50 /mo -Premium: $22 /mo | Quick built-in email usage summary without extra cost | Small businesses, IT admins managing multiple accounts |
| Email Meter | -Free: $0 (basic stats) -Plus: $19/user/mo (or $15 billed yearly) -Custom Dashboard: quoted | Rich, exportable Outlook email analytics for teams | Managers tracking team performance |
| Power BI | -Free: $0 -Pro: $14/user/mo -Premium: $24/user/mo | Build custom Outlook dashboards and combine with other data sources | Enterprises, data-driven orgs needing BI integration |
| EmailAnalytics | -$19/user/mo (14-day free trial available) | Quick visual dashboards of Outlook activity, simple and actionable | Sales and support teams needing quick insights |
| Zoho Analytics | -Always Free: $0 (2 users, 10k rows) -Basic: $10/mo -Standard: $21/mo -Premium: $48/mo -Enterprise: $180/mo | Combine Outlook data with CRM/finance for deeper BI reporting | Cross-functional teams, SMBs scaling reporting |
| Tableau | -Viewer: $15/user/mo -Explorer: $42/user/mo -Creator: $75/user/mo | Enterprise-grade BI: visualize Outlook email metrics alongside other data | Large enterprises, operations, executive reporting |
| timetoreply | -Essentials: $25/mailbox/mo (annual) -Pro: $34/mailbox/mo (annual) -Premier: custom | Response-time and SLA analytics for sales & service teams | Customer support, service, and sales teams |
| ContactMonkey | -Custom pricing (based on features required) | Internal comms tracking—open rates, clicks, sentiment in Outlook | HR, internal communications, employee engagement |
| Worklytics | -Custom pricing | Combines Outlook email + calendar data to analyze productivity trends | Large orgs focused on productivity and burnout prevention |
Recommended reading
10 Top Microsoft Outlook Analytics Tools
Microsoft Outlook Analytics can significantly enhance your email management by providing valuable insights into your email usage. To make the most of these analytics, here are ten Outlook email analytics tools that can help you track and analyze your emails:
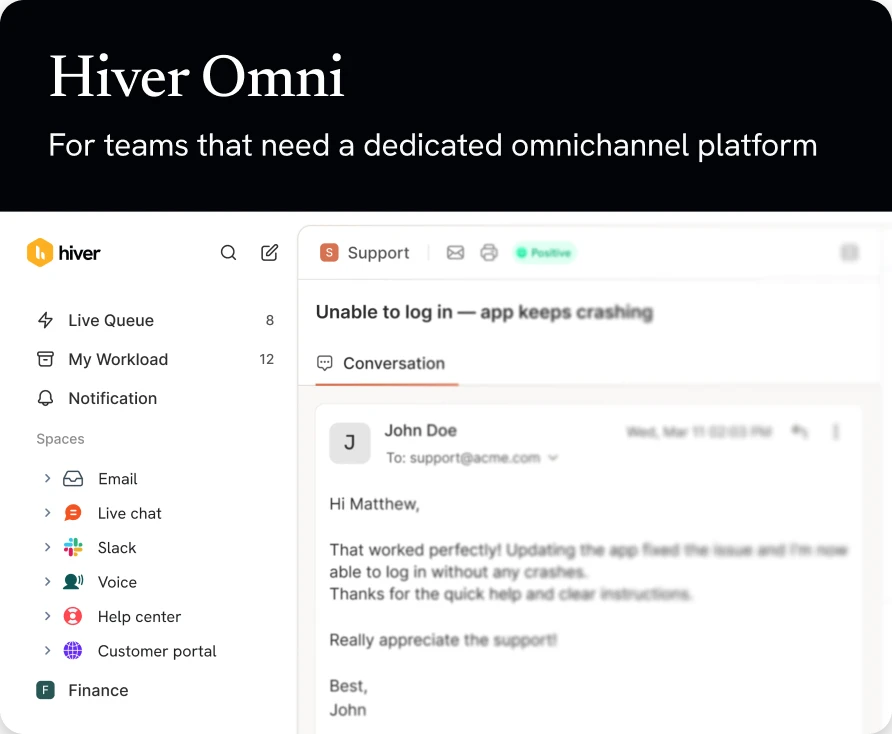
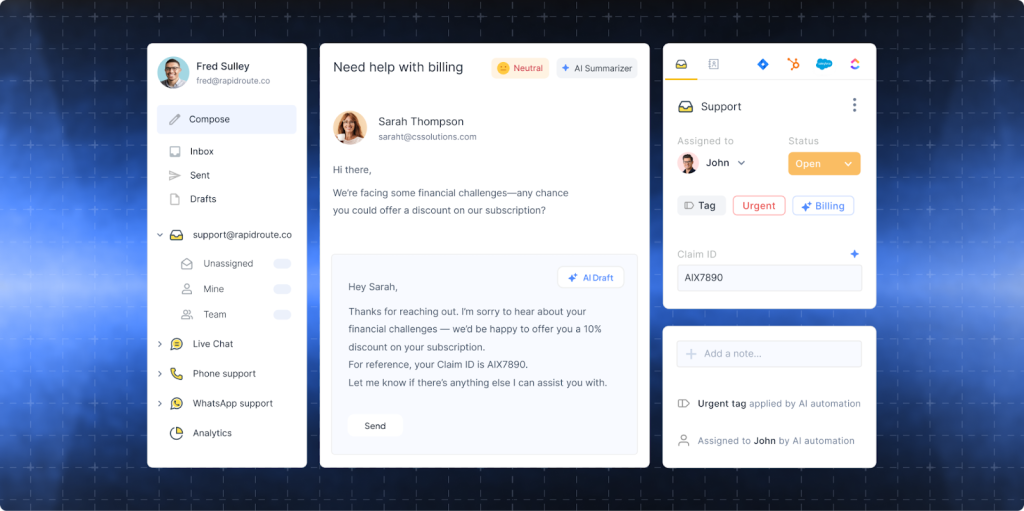
1. Hiver
Hiver is an AI-powered customer service platform that integrates with Outlook. It syncs directly with your inbox and adds features for shared inbox management, collaboration, and performance tracking.
For teams that use Outlook to manage customer or internal emails, Hiver makes it easy to assign ownership, add notes, and collaborate without messy CCs or forwards. The familiar inbox-style layout means you can get started within minutes.
Beyond collaboration, Hiver gives you detailed analytics on how emails are handled. You can track average response times, resolution times, conversation volumes, busiest hours, and SLA compliance. These insights help managers see where conversations are stuck, redistribute workloads, and effectively coach team members.
Here are some of Hiver’s key features:
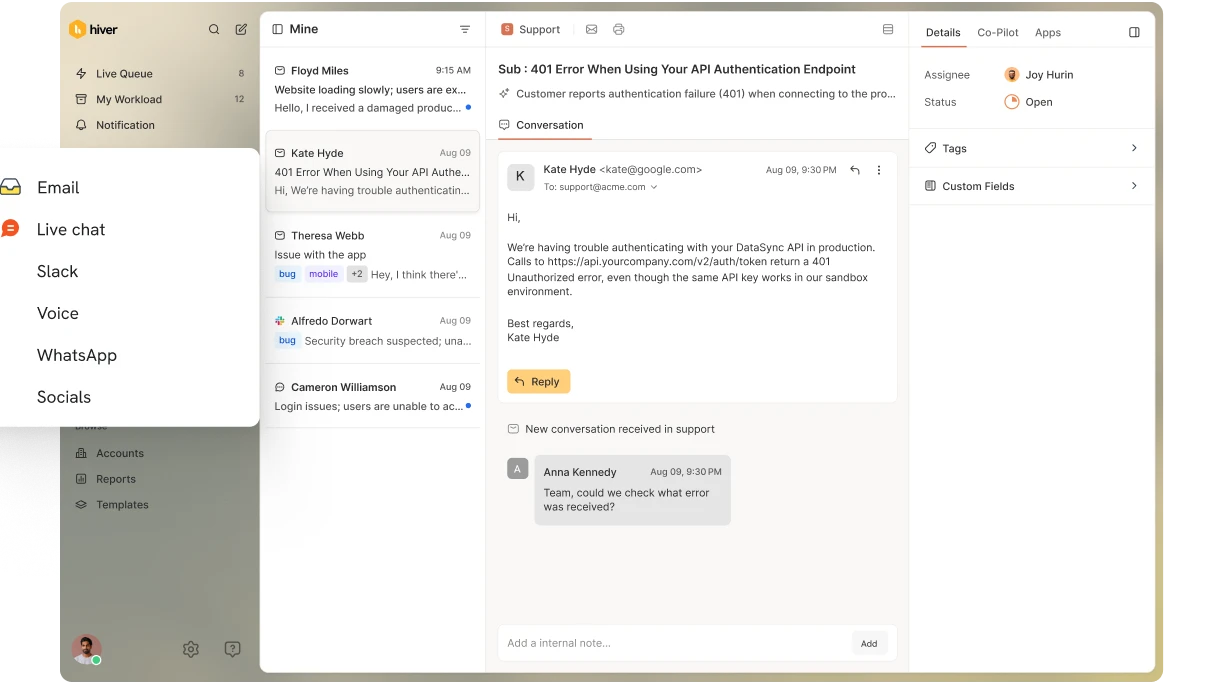
Shared inboxes
Hiver turns addresses like support@ or info@ into shared inboxes that the whole team can access. Every email is visible, so nothing gets missed or answered twice. From there, conversations can be assigned to specific teammates, giving each query a clear owner. Managers get visibility into who owns what, and analytics show how quickly each query is handled.
Collaboration tools
Hiver lets your team add notes beside an email thread, so every piece of context stays in one place. You can assign a conversation to the right person with a click. And if you need help, just @mention a teammate and loop them in instantly.
Managers can then see which conversations are moving smoothly and which are stuck, making it easier to intervene and resolve issues.

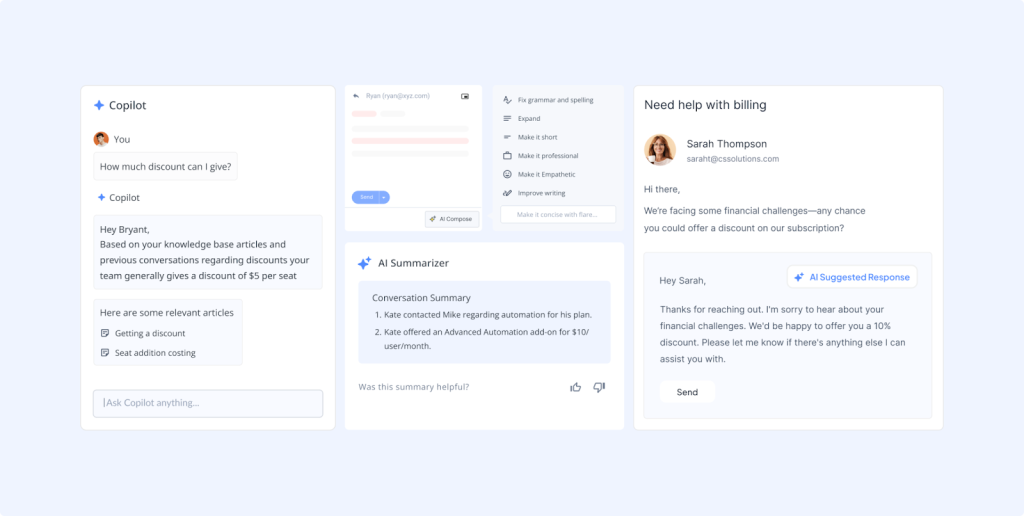
AI Copilot
Outlook shows you the emails, but it doesn’t help your team reply faster. As volume grows, replies slow down and conversations pile up.
That’s where Hiver’s AI Copilot comes in. It drafts replies using your knowledge base, routes emails to the right person, and summarizes long threads so you can respond without digging through context. Less manual work means faster replies and fewer missed SLAs.
Reporting and analytics
Outlook gives you visibility into emails but not how your team is performing.
Hiver’s reporting shows you response times, workloads, volumes, and CSAT in one place. More importantly, it helps you act on it. You can spot bottlenecks, rebalance work, and catch delays early. With trend analysis, custom reports, and dashboards, you’re not just seeing activity, you’re improving how your team handles it.
Automations
Outlook rules can move emails into folders or flag them, but that’s about it. They don’t assign ownership, enforce deadlines, or tell you when something is slipping. Hiver takes automation several steps further.
You can route emails based on keywords, for example, all billing queries go straight to finance. You can tag conversations automatically, set statuses, and enforce SLAs with reminders or escalations when replies are late. As a result, you get faster responses, less manual sorting, and cleaner analytics because every query is categorized as it comes in.
Teams that like Outlook’s simplicity but need advanced analytics and collaboration features will find Hiver as a great tool. As a user said,
“Hiver increased the efficiency by which we address emailed questions and concerns. Hiver increases transparency between team members. Information pertinent to one or more team members is searchable by all applicable team members, making it easier to research a situation that otherwise could have been stored in detail across separate member email histories. Team accountability was a huge improvement. Scaling support without introducing a new platform – big win!”
Pricing
Hiver has a free plan that can get you started. You can scale it with your needs, using the pricing plans below:
- Growth – $25/user/month: This plan adds detailed team performance analytics and flexible, customizable reports so you can start measuring things like response patterns, email backlog, and user-level workload.
- Pro – $45/user/month: Unlocks advanced dashboards, SLA tracking with automation, CSAT measurement, scheduled exports, and integrations via Zapier or API. Analytics here turns into coaching and planning power.
- Elite – $75: This plan is built for large teams that need scale. It offers unlimited inboxes, skill-based routing, HIPAA compliance, SSO via Okta, and a customer success manager, analytics fuel smart operations at scale.
Hiver’s AI-powered Copilot is now available separately as an add-on for $20/user/month on top of any plan.

2. Office 365 Reports:
Office 365 offers built-in reports that give you a snapshot of your email activity like sent and received emails, active users, and overall usage patterns. You also get product-level reports, which help you understand how different tools within the suite are being used.
That said, the reporting is fairly basic. It gives you a high-level view of activity, but lacks the depth needed to track team performance, identify bottlenecks, or act on insights in real time.

They are particularly useful for administrators who need to monitor email activity across their organization. For example, an admin can see which departments send the most emails and adjust resources accordingly.
Key Features:
- Email activity reports
- User activity insights
- Sent and received email metrics
Pricing
Office 365 Reports come included with Microsoft 365 subscriptions at no extra cost.
- Microsoft 365 Family – $129.99/user/year
- Microsoft 365 Personal – $99.99/user/year
- Microsoft 365 Basic – $19.99/user/year
(Analytics features are available across plans, though depth of reporting may vary.)
3. Email Meter
Email Meter is an analytics tool designed to provide detailed insights into your email activity. It tracks metrics such as email response time, traffic by day and hour, and top senders and recipients. This tool is particularly beneficial for teams needing to monitor performance and enhance productivity.

Email Meter stands out with its advanced reporting capabilities, offering a comprehensive view of your email habits. It helps identify communication patterns and areas for improvement, making it easier to manage and optimize email workflows.
Key Features:
- Email activity reports
- Response time tracking
- Top sender and recipient metrics
Pricing
Email Meter offers a free plan for individuals, with advanced analytics available on paid tiers:
- Free – $0/month (basic stats, weekly/monthly reports, response metrics, top interactions).
- Plus – $19/user/month (or $15/user/month when billed yearly): adds advanced filters, two years of data, team performance reports, custom date ranges, CSV export, alerts, and goals.
Custom Dashboard – Custom pricing: includes SLA reporting, multichannel monitoring, domain-wide installation, enhanced security, and a dedicated onboarding experience.
4. Power BI:
Power BI is a powerful business analytics tool that integrates with Outlook to provide advanced data visualization and reporting capabilities. It helps you create power BI reports and dashboards, enabling you to analyze your email data more effectively.

Power BI’s flexibility allows you to customize reports to suit your specific needs, making it ideal for large organizations that require detailed analytics.
Key Features:
- Customizable dashboards
- Advanced data visualization
- Detailed email reports
Pricing
Power BI is available as part of Microsoft’s ecosystem with flexible plans:
- Power BI Free – $0: Create personal dashboards and reports.
- Power BI Pro – $14/user/month: Share dashboards, collaborate, and access Office 365 integrations.
Power BI Premium – $24/user/month per user: Advanced features, larger data volumes, and dedicated cloud resources.
5. EmailAnalytics:
EmailAnalytics is a tool that integrates with Outlook via an API. It provides detailed analytics on your email activity. It helps you track metrics such as email response time, email traffic by day and hour, and top senders and recipients.

This tool is especially useful for sales and support teams who need to monitor their email performance closely. For example, a sales team can track which emails get the most responses and adjust their strategies.
Key Features:
- Email response time tracking
- Email traffic analysis
- Top sender and recipient metrics
Pricing
EmailAnalytics keeps pricing straightforward with a single paid plan:
Pro: $19/user/month (with a 14-day free trial) – includes full analytics, dashboards, and reporting features
6. Zoho Analytics
Zoho Analytics is a business intelligence and reporting tool that connects with Outlook to give you insights far beyond what Outlook’s built-in reports provide.
Outlook can show you the basics, like how many emails were sent or received. But it can’t tell you how response times vary between teams, which conversations remain unresolved, or how email activity impacts customer outcomes. Zoho fills that gap by importing your Outlook data and turning it into customizable dashboards.
With Zoho, you can track workload distribution across departments, compare performance week over week, and connect Outlook data with CRM or finance tools to see the bigger picture. You can even use AI to forecast trends, spot bottlenecks, and find correlations like whether faster replies lead to better customer retention.

You can combine this with CRM, project, or finance data to see the bigger picture.
Key features
- Import Outlook data via connectors or APIs for advanced reporting.
- Using pre-built email analytics templates, such as response time dashboards or volume by day/hour, to start tracking email performance without building reports from scratch.
- Blend Outlook email analytics with CRM or HR data to create cross-functional dashboards.
- Ask Zoho’s AI assistant, Zia, questions in plain English, like “Show me average response time by team last month,” and you’ll get instant charts or tables.
- Share dashboards securely with teammates or clients, giving each group only the access they need.
Pricing
Zoho Analytics offers multiple tiers (billed annually):
- Always Free – $0/month: Supports two users, 5 workspaces, and up to 10,000 rows of data.
- Basic – $10/month: Supports two users, 0.5 million rows, and unlimited workspaces.
- Standard – $21/month: Supports five users, 1 million rows
- Premium – $48/month: Supports 15 users, 5 million rows
- Enterprise – $180/month: Supports 50 users, 50 million rows
You also get a 15‑day free trial on paid plans to test things out.
Recommended reading
What is Customer Experience Automation (CXA)? A Practical Guide with Examples
7. Tableau
Tableau is a business intelligence platform that helps you analyze and visualize Outlook data at scale. It’s designed for organizations that need more than email counts and want to connect Outlook activity with wider business outcomes.
By connecting Outlook through Microsoft Graph or APIs, Tableau pulls in your email data and transforms it into interactive dashboards. Unlike Outlook’s built-in reports, these dashboards let you blend email metrics with sales, finance, or support systems data to get a unified view.

With Tableau, you can track response times, workloads, and volumes, and layer that against KPIs like revenue, deal velocity, or customer satisfaction. Advanced visualizations like heat maps, trend lines, and forecasts help you spot patterns and plan ahead. In short, it turns Outlook analytics from isolated numbers into business-wide insights.
Key features
- Connect to Outlook using Microsoft Graph, APIs, or third-party extractors.
- Build custom dashboards to track metrics like response times, email volume, and team workloads.
- Combine email analytics with broader business data for a full-context view.
- Use richly interactive visuals such as maps, trend lines, heat maps, and forecasts to spotlight insights.
- Enterprise-grade security, governance, and user control with role-based access
Pricing
- Viewer – $15/user/month; for users who need to view and interact with dashboards without creating them.
- Explorer – $42/user/month; allows users to ask questions, edit dashboards, and work with published data.
- Creator – $75/user/month; full access to Tableau Desktop, Prep Builder, web authoring, and dashboard creation.
It’s best for large teams or enterprises using Microsoft Outlook who want polished, interactive analytics alongside business-wide dashboards.
8. Timetoreply
Timetoreply is an Outlook analytics tool built to measure email responsiveness. It shows exactly how long your team takes to send the first reply, resolve a thread, or meet agreed SLAs.
Once connected to your Outlook inboxes, timetoreply tracks every customer-facing email and calculates response times in real time. Managers can compare individuals or teams, spot delays, and prove SLA compliance with hard data.

Managers can track average response times, see volumes by team or individual, and measure whether SLAs are being met.
Key features
- Response-time tracking for individuals and teams.
- Reports on first reply time, resolution time, and total volumes.
- SLA compliance monitoring with alerts for slow replies.
- Exportable reports for performance reviews.
- Works with both Outlook and Gmail.
Pricing
- Essentials: $36 per mailbox/month (billed annually) or $25/month (if billed monthly).
- Pro: $44 per mailbox/month (annually) or $34/month (monthly); includes full report suite and customer success support.
9. ContactMonkey
ContactMonkey brings analytics to internal emails sent via Microsoft Outlook. It tracks engagement on newsletters, announcements, and updates so HR and internal comms teams know what’s being read.

Key features
- Track open rates, link clicks, and read times for internal emails.
- Add surveys and feedback forms directly into Outlook messages.
- Analyze engagement across departments or employee groups.
- Works seamlessly with Outlook and Office 365.
- Embedded pulse surveys.
- Emoji reactions.
- Feedback scores.
- Sentiment is inferred from survey responses and reactions, not from NLP analysis of email text.
Pricing
Pricing is custom and depends on the features required (quotes available on request)
10. Worklytics
Worklytics connects Outlook email and calendar data to show how teams spend their time. This helps it spot productivity drains, such as too many meetings or uneven workload distribution.
Worklytics highlights how time is being spent. You’ll see how much of the week goes into meetings, how collaboration flows across departments, and where workloads might be uneven.
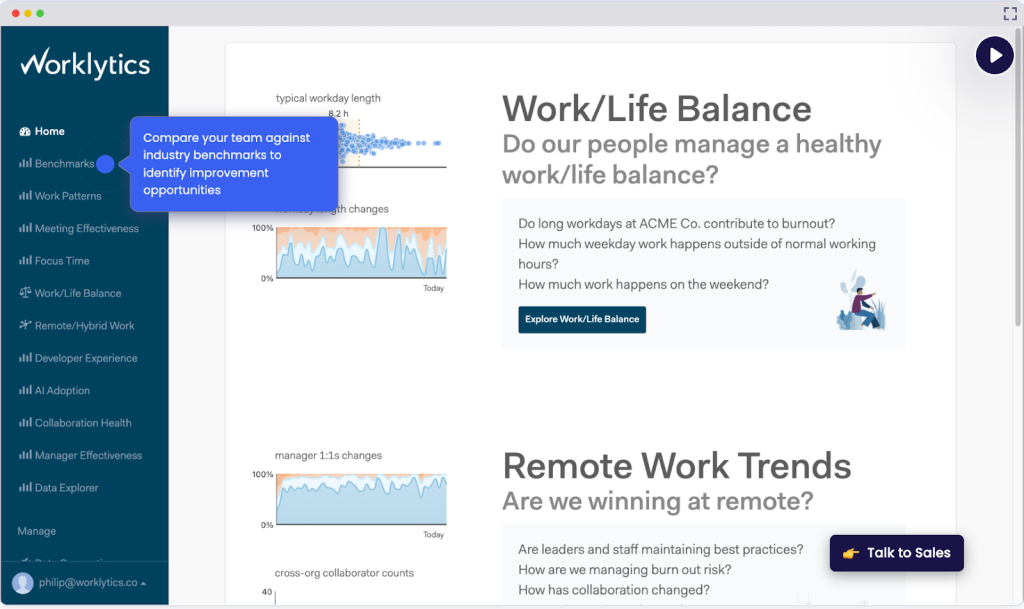
Dashboards make it easy to see whether time is being used on deep work, collaboration, or administrative overhead, so leaders can rebalance priorities and reduce burnout.
Key features
- Combine email and calendar data for a full picture of work habits.
- Track collaboration trends across teams and departments.
- Spot productivity blockers like meeting overload or email delays.
- Secure, privacy-first design (no email body content stored).
- Customizable dashboards for managers and executives.
Pricing
Custom pricing based on company size and needs. No standard pricing on their website.
How to Integrate the Microsoft Outlook Analytics Tool?
If you’re ready to see how your team uses Microsoft Outlook analytics tools, setting up takes just a few steps. Let’s look into it:
1. Pick the right Outlook email analytics tool: Decide what you need from analytics. If you just want high-level numbers, Microsoft 365 Reports will work. For detailed team performance, go with Hiver, Email Meter, or Timetoreply. If you need custom dashboards, Power BI, Zoho, or Tableau is the way to go.
2. Install it: Most tools are available on Microsoft AppSource or the vendor’s website. Click “Get It Now,” follow the prompts, and the add-in will connect to your Outlook account.
3. Allow permissions: You’ll be asked to grant access to your mailbox data (such as subject lines, recipients, and timestamps). Don’t worry, tools typically use metadata only, not the content of your emails.
4. Add your team: If you’re setting this up for a team inbox like support@ or sales@, invite your colleagues. That way, you’ll see the full picture instead of just your data.
5. Open the dashboard: Your tool will generate reports once connected. You’ll see metrics like average response time, busiest hours, and unresolved threads presented clearly instead of buried in inbox clutter.
6. Take action: The real value comes from using the insights. Reassign work if one person is overloaded, set benchmarks for faster responses, or build rules to handle repetitive queries.
After doing this, your Outlook will stop being just your inbox. It becomes a tool you can measure and improve.
Recommended reading
Key Features to Look for in a Microsoft Outlook Analytics Tool
When choosing an Outlook email analytics tool, it’s essential to consider the features that will provide the most value to your workflow. Here are some key features to look for:
1. Comprehensive Email Tracking: The right tool should track response times, open rates, and click-throughs. These insights show how people engage with your emails and give you the data to improve communication strategies.
2. Customizable Reports: Look for tools that filter by date ranges, team members, or customer segments. Custom reporting means you’ll always have the data that matters most to your goals.
3. User-Friendly Dashboards: Choose tools with clear, intuitive dashboards that surface the key metrics at a glance. If your managers can’t interpret the data in minutes, the tool will slow you down instead of helping.
4. Integration with Other Tools: Pick a tool that connects with your CRM, helpdesk, or project management system. This way, you can tie email activity directly to customer relationships, deals, or projects.
5. Data Security and Privacy: Any tool you choose should offer encryption, strict access controls, and compliance with regulations like GDPR or HIPAA. Security isn’t a “nice to have”, it’s non-negotiable.
The right tool can turn Outlook into a source of insights you can act on.
Make Microsoft Outlook Work Smarter With Analytics
Microsoft Outlook will always be a dependable email tool. But without analytics, it leaves you guessing. Emails get missed, workloads pile unevenly, and response times slip.
Outlook Analytics fixes that. It gives you visibility into how your team communicates: response times, busiest hours, unanswered emails, and overall workload. With that data, you can act, redistribute work, tighten response times, and make sure no conversation gets lost.
Tools like Email Meter, EmailAnalytics, Power BI, Zoho Analytics, and Tableau add reporting layers to Outlook.
But if you want the familiarity of an inbox with built-in analytics, automation, and AI capabilities, that’s exactly what Hiver delivers. And the best part? You can try Hiver for free before deciding if it’s right for your team.
Pick one tool, connect it to your Microsoft Outlook account, and track your first set of metrics this week. You’ll immediately see how your inbox is managed and where to improve.
Frequently Asked Questions
1. Can I get analytics from Outlook?
Yes, but only at a basic level. Outlook itself shows limited insights, and Microsoft 365 Reports add some organization-wide data. For deeper analytics like response times or workload distribution, you’ll need third-party tools such as Hiver, Email Meter, or Power BI.
2. Where can I find my analytics in Outlook?
If you’re on Microsoft 365, analytics can be found in the admin center under “Reports.” Individual users with Viva Insights can also view personal productivity data directly in Outlook.
3. What are 5 categories of analytics tools?
The main categories are descriptive (what happened), diagnostic (why it happened), predictive (what could happen), prescriptive (what to do next), and real-time analytics (what’s happening now).
4. How do I turn on Outlook insights?
You need Microsoft Viva Insights, which is included in some Microsoft 365 plans. Once enabled by your admin, it appears as an add-in inside Outlook where you can track personal productivity trends.
5. What is the Outlook inbox analysis tool?
It’s a feature in certain Microsoft 365 setups, often tied to Viva Insights or third-party add-ins, that helps you analyze inbox patterns like email volume, response time, and collaboration trends.
6. What are the most important Outlook email metrics to track?
The key metrics are emails sent/received per day, average response time, email open rates, first response time, busiest times/days, and unresolved threads. Together, they show how responsive your team is when workloads peak, and where conversations are getting stuck, helping you rebalance work and improve performance.
7. Does Outlook have built-in email analytics?
Yes. Outlook provides email analytics through Viva Insights (for individuals) and the Microsoft 365 Admin Center (for org-wide usage reports). These tools show open rates, email counts, and mailbox activity.
8. How do I see open rates in Outlook?
Enable the Viva Insights add-in in Outlook. It provides a “Track email and document open rates” feature and shows how many recipients opened your email and how long they spent reading it.
9. Where are Microsoft 365 email activity reports located?
Go to Microsoft 365 Admin Center → Reports → Usage → Email Activity. You can filter by date range, export to Excel, and analyze metrics like sent, received, and read emails per user.
10. Can I measure shared mailbox response times in Outlook?
Outlook’s native tools don’t offer response-time analytics for shared mailboxes. Use third-party tools like Hiver, Email Meter, or timetoreply to track SLA compliance and workload distribution.
Start using Hiver today
- Collaborate with ease
- Manage high email volume
- Leverage AI for stellar service