



Insights, dashboards, and
metrics. Powered by AI.
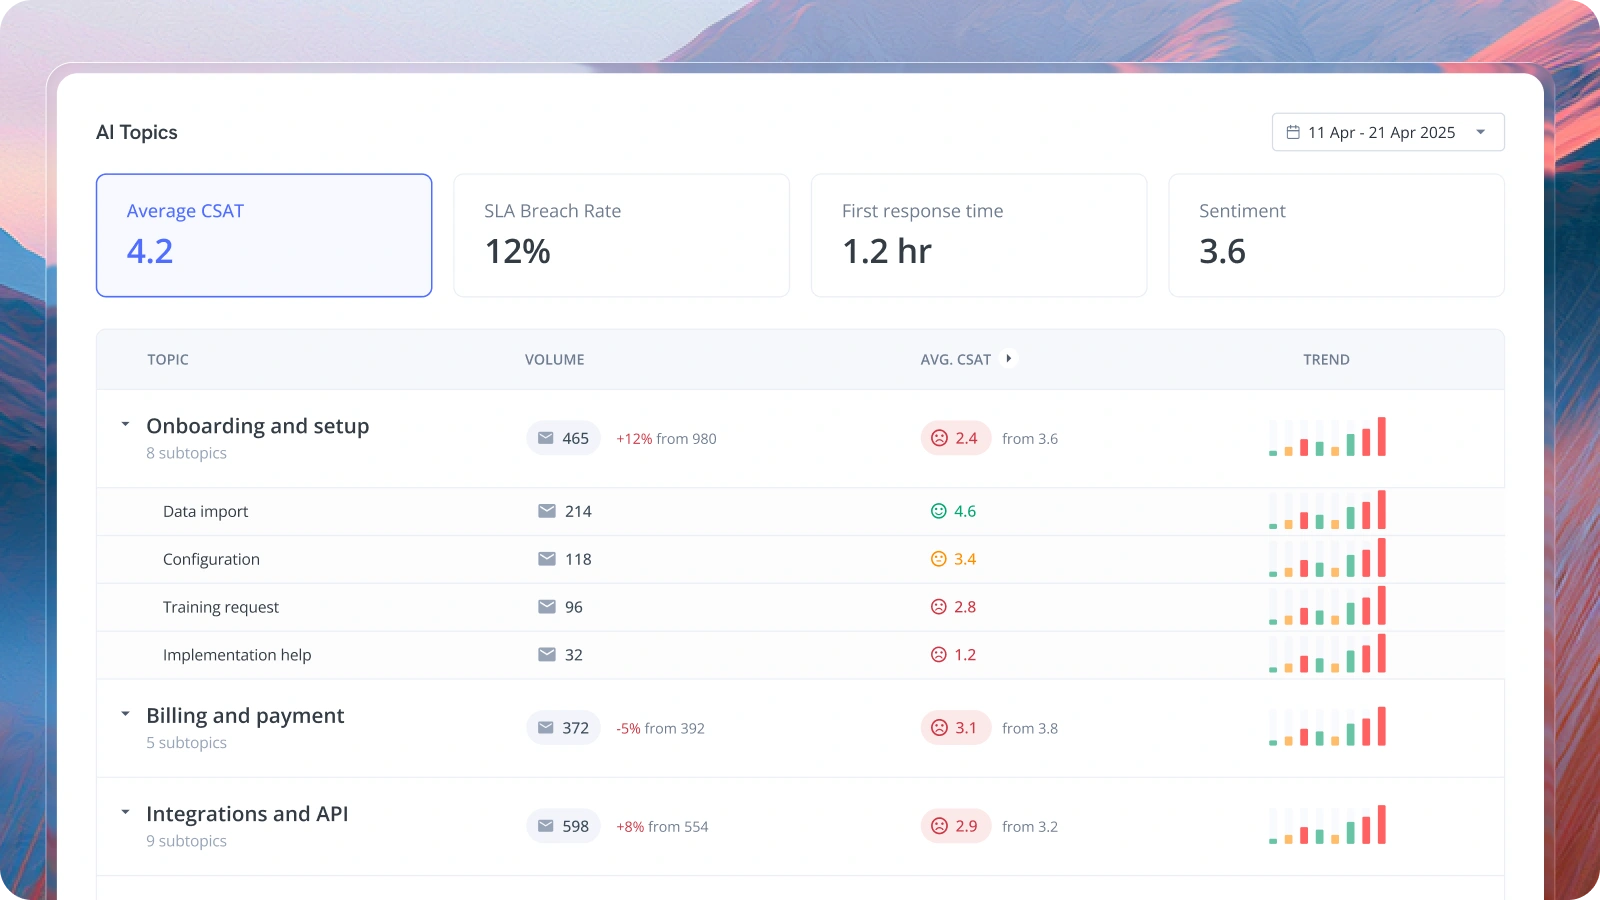
Why customers reach out, who needs coaching, which accounts are at risk. Every answer, one drill-down away.
Patterns, sentiment, quality, gaps.
Uncover every blind spot with AI.
Topics: the real reasons customers reach out
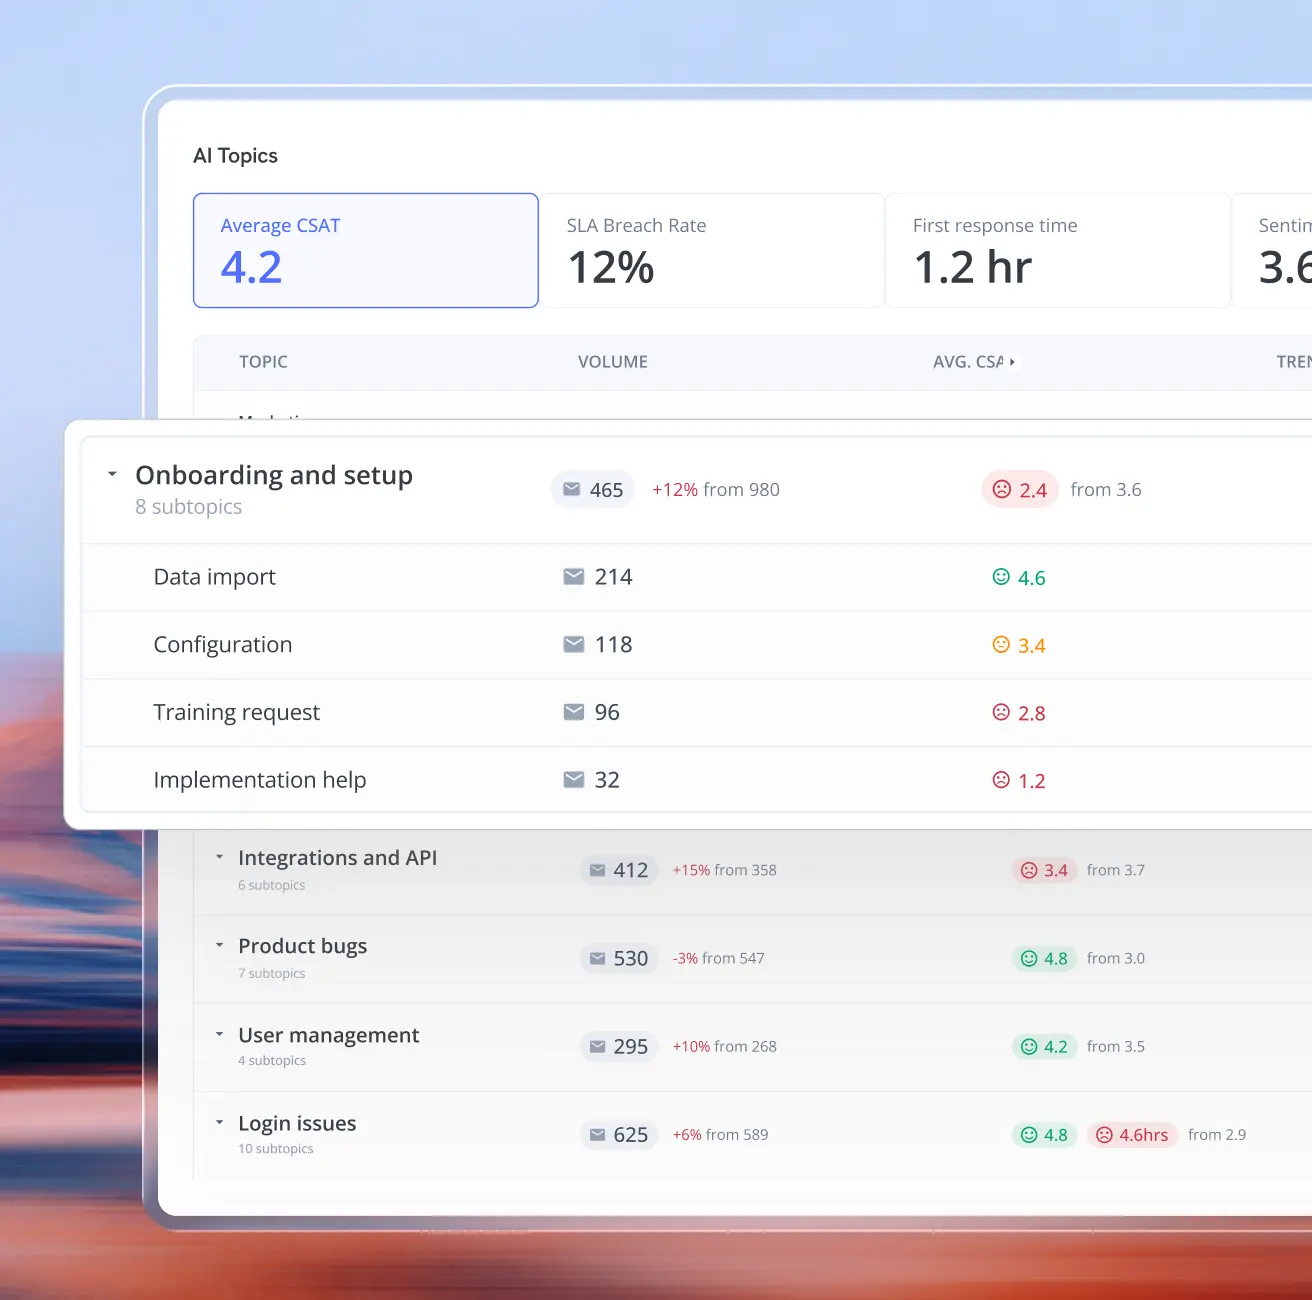
AI sorts every conversation by topic, so you see what’s actually driving your volume.Each topic carries its own response time, resolution time, and CSAT, so you know what to fix.
Sentiment: catch frustration before churn
AI reads the customer’s tone in every conversation. See where frustration is building across the queue, then drill into the ones that could have gone better.
QA: Review every reply. Coach every agent.
AI scores every reply your team sends for tone, accuracy, and completeness. Get automated QA scores across the team, drill into individual conversations to see what went wrong, and coach from evidence instead of hunches.
Knowledge: Know exactly which doc you're missing
AI analyzes all tickets to spot the docs you’re missing so you know exactly what to write. It’ll even auto-draft and publish the articles for you.
Track team performance without the Excel archaeology.
Monitor performance metrics across channels
See response time, workload, SLAs, and CSAT across every channel and team at once. Break any metric down by channel, or roll them all up, without five open tabs.
Track SLAs and CSAT, side by side
See how your team is pacing against the reply-time goals you set per channel, and read CSAT across every conversation.
Root causes, not symptoms.
Drill into any metric at the conversation level. When SLA slips, you find the exact thread that caused it, not just the number that moved.
Build dashboards your way

Build a dashboard to track every single metric your team cares about, then schedule it to land in everyone’s inbox. Nobody has to go looking.
Spot the account about to churn before it tells you
Health and sentiment for every account in one view, pulled from your conversations, CRM, customer calls, and product usage. The moment health slips or sentiment turns, you know.
Plus, everything you need to put the data to work
Live dashboards
Publish your support dashboard, privately or publicly. Updates happen in real time, so everyone stays in sync on the metrics that actually matter.
Data retention
Keep your data for as long as you need it. Put this quarter next to last year and catch the trends that only show up once you have the full timeline in view.
Data exports
Take your data wherever your reporting lives. Schedule exports straight into the BI tools you already run on, from Snowflake to Looker to Tableau.