


Table of contents


10,000+ teams use Hiver to delight their customers
10 Customer Experience Metrics and KPIs Every Business Must Track

Table of contents
I don’t need to tell you that customer experience is a key differentiating factor between you and your competitors. You probably already know that and have a number of well thought-out strategies in place to improve your customers’ experience.
But how do you know if your methods are working? How do you know how your customers really feel about doing business with you?
The answer lies in measuring and tracking customer experience (CX) metrics.
Unless you quantify the impact of your customer experience strategies through these metrics, you’re pretty much just playing a guessing game. You don’t want to take a shot in the dark.
You need clarity on where your customers stand with you. Otherwise you won’t be able to tell when they’re unhappy and thinking of switching to a competitor.
In this article, we’ll delve into:
- What are customer experience metrics?
- Why you should track CX metrics
- 10 fundamental CX metrics and KPIs that every business must track
Table of Contents
- What are Customer Experience Metrics?
- Why Tracking Customer Experience Metrics is Important
- 10 Customer Experience Metrics you Must Track
- Getting Started
What are Customer Experience Metrics?
Customer experience metrics are measurements that provide insights into how your customers perceive and interact with your product or service. They offer a way to gauge customer satisfaction, loyalty, and the quality of interactions customers have with your brand.
With these metrics, businesses can understand the exact thoughts and feelings of their customers, allowing them to make informed decisions for improving the overall customer experience.
Why Tracking Customer Experience Metrics is Important
Here are a few reasons to start tracking customer experience metrics:
- Identify areas for improvement: Customer experience metrics provide you with insights into customers’ interaction with your business. By analyzing these metrics, you can pinpoint specific pain points and shortcomings in their experience. Once you identify these problem areas, you can take targeted actions to address them.
Consider this interesting example; you notice your company has a very high First Contact Resolution rate. Upon further analysis, you realize that most incoming queries are very simple questions that have already been addressed in your knowledge base. This means that your knowledge base, while packed with all the necessary information, is not usable or is tough to navigate. This is why customers have been reaching out to agents for even the most straightforward issues. Once you realize this, you can redesign the structure of your KB to make it more user-friendly and search-friendly.
- Increase customer satisfaction and loyalty: By consistently tracking and optimizing CX metrics, you’re addressing all the problems and frustrations of your customers. All of this results in happy customers who give you repeat business.
For example: By reducing your First Response Time, you make your customers wait less for a response. This way they get peace of mind that someone’s working on their problem and won’t get frustrated and anxious. This will result in a better experience and greater satisfaction overall.
- Make data-driven decisions: When you have access to quantifiable data and insights into how customers feel about your brand, you’ll be able to make decisions that are based on actual customer needs and not on what you ‘think’ that they want.
For example, when you track a metric such as Customer Effort Score, you’ll get various insights into areas of your product or service that are high effort for your customers. It could be that your product has a complex UI which is leading to high-effort experiences for your customers. With this information, you can invest resources in improving your UI and create more intuitive experiences for your customers.
10 Customer Experience Metrics you Must Track
Now that we’ve discussed the importance of tracking customer experience metrics, the question that comes up next is “Which ones should I track?”.
There’s an endless list of metrics to pick and choose from and deciding on the ones to track can be overwhelming. Let me simplify it for you – here are the 10 most important customer experience metrics you should focus on:
1. Customer Satisfaction Score (CSAT)
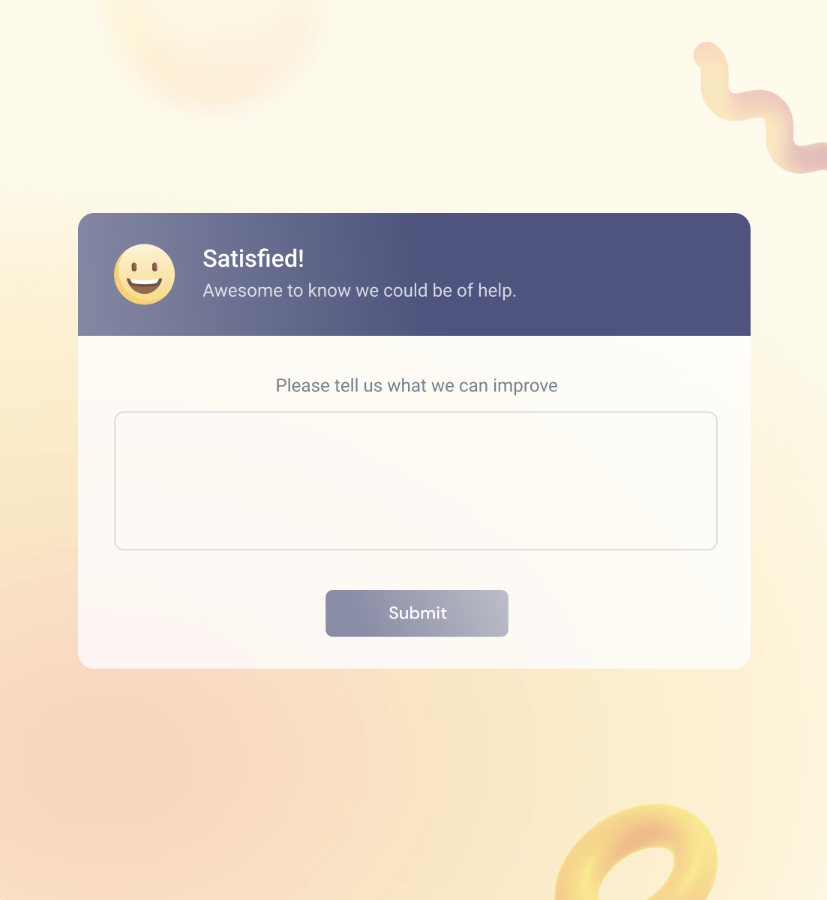
Customer Satisfaction Score (CSAT) is a widely used metric that measures the satisfaction a customer has with a product, service, or interaction with a company. The way to measure your CSAT is through CSAT surveys which are generally sent after specific customer interactions, such as a support call or post-purchase follow-up, to assess immediate satisfaction.
The questions in CSAT surveys are short and simple, and they can be administered through various channels, such as email, text message, or in-app. The most common type of customer satisfaction survey is a rating scale question.
For example: “How satisfied are you with our product/service on a scale of 1 to 5 (or 1 to 7)?” Respondents select a number that represents their level of satisfaction.
Higher the rating, higher the satisfaction.
Benefits:
- CSAT helps in identifying areas of improvement and addressing customer pain points promptly.
- It can be used to compare satisfaction levels across different customer segments or time periods.
- By monitoring CSAT, organizations can measure the effectiveness of changes made to improve the customer experience.
33 CSAT Survey Templates for Your Customer Support Team
2. Net Promoter Score (NPS)
Net Promoter Score (NPS) is a customer experience metric that’s used to measure customer loyalty and gauge a customer’s willingness to recommend a company’s products or services to others.
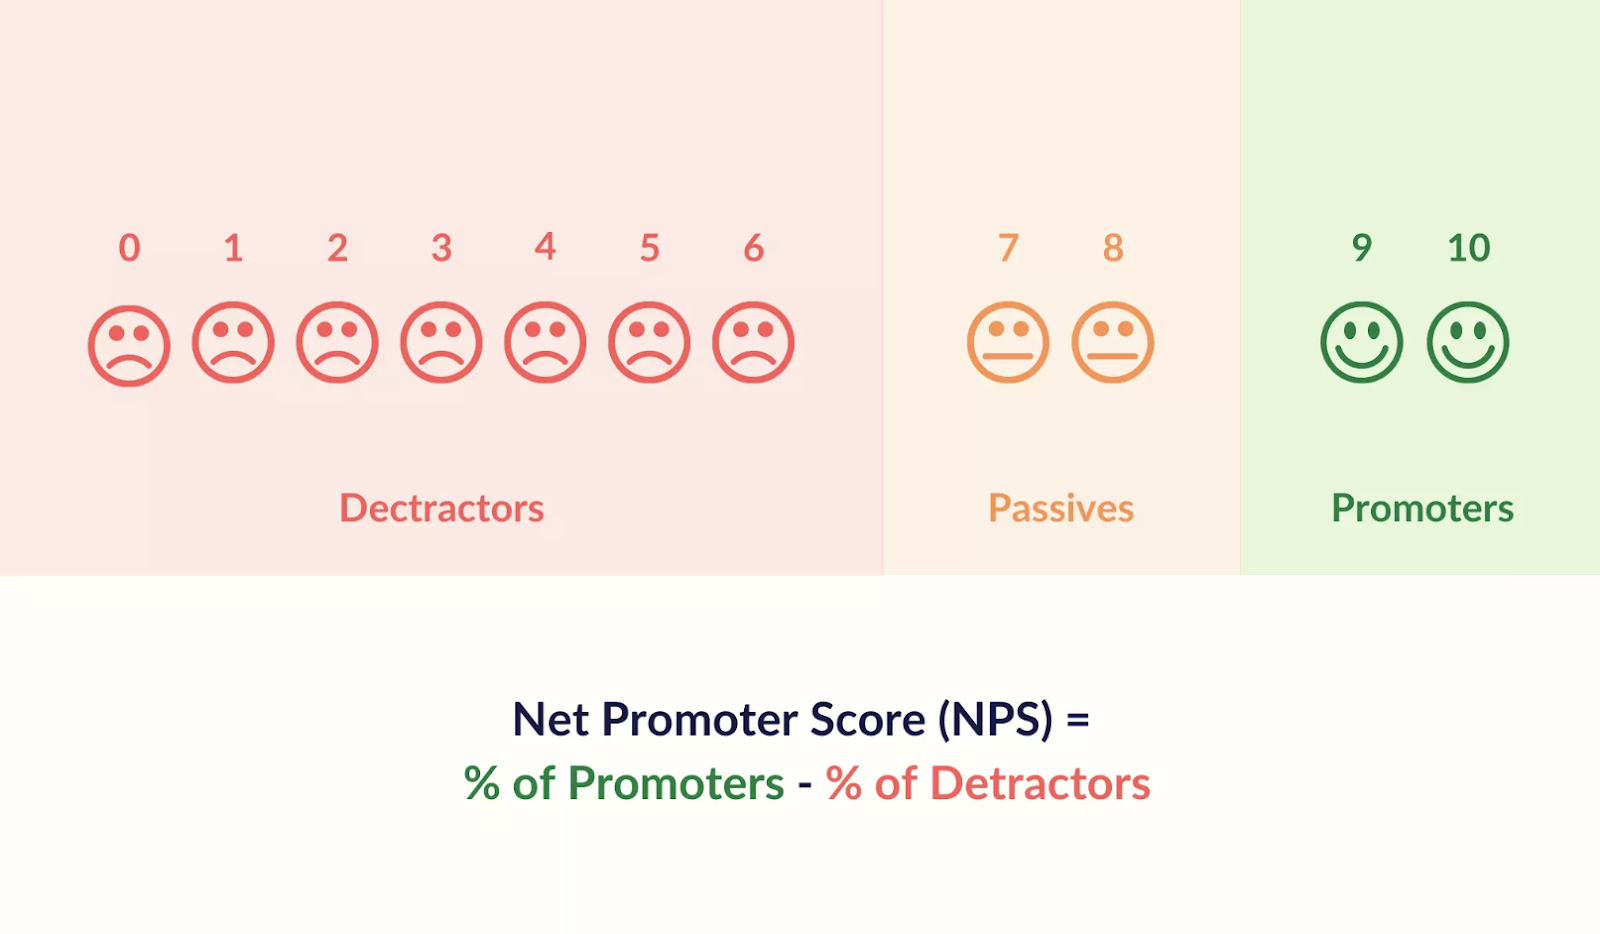
Calculating NPS involves asking a simple question – “On a scale of 0 to 10, how likely are you to recommend our company/product/service to a friend or colleague?”. Based on their responses, customers are categorized into three groups: Promoters (score 9-10),Passives (score 7-8),and Detractors (score 0-6).
- Promoters – Customers who are highly likely to recommend your product.
- Passives – Neutral customers who are neither too happy nor too frustrated with your business. They aren’t factored into the NPS calculation.
- Detractors – Customers who are highly unlikely to recommend your product.
Your NPS = % of promoters – % of detractors
NPS goes beyond satisfaction by focusing on customer advocacy. It helps businesses understand the overall sentiment of their customer base and identify those who are enthusiastic advocates and those who may be detractors. This information is valuable for measuring customer loyalty and predicting future business growth.
Benefits:
- NPS helps in identifying loyal customers who can become brand ambassadors, actively promoting your products or services.
- It provides a simple yet effective benchmark for tracking customer loyalty over time.
- Companies can target detractors for follow-up and address their concerns, potentially converting them into promoters.
3. Customer Effort Score (CES)
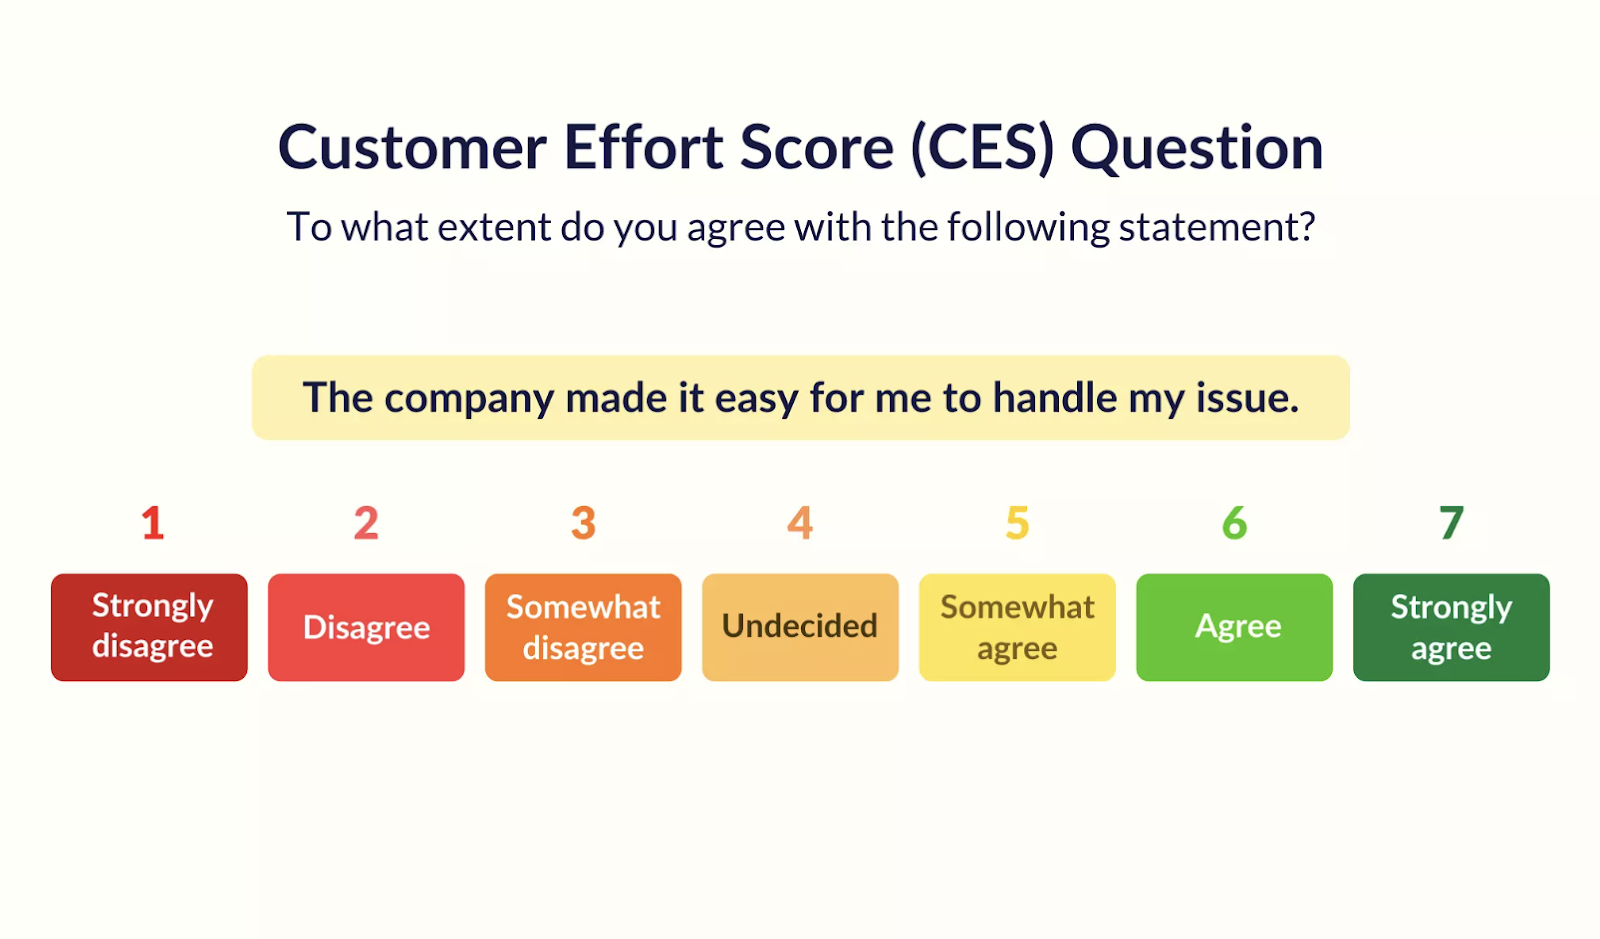
Customer Effort Score (CES) evaluates the ease or effort with which customers can accomplish a specific task or resolve an issue while interacting with a company.
CES questions look like – “How easy was it for you to contact our customer support team today?”
Respondents typically rate their experience on a scale, often ranging from “very difficult” to “very easy.”
53 Effective Customer Effort Score (CES) Questions
CES focuses on the practical aspects of the customer experience, emphasizing the importance of reducing customer effort to enhance satisfaction and loyalty. Low-effort experiences tend to result in higher customer retention and advocacy.
Benefits:
- CES helps businesses pinpoint pain points and areas where customers might experience frustration or inconvenience.
- It aids in measuring the impact of process improvements on the customer experience.
- Companies can use CES to prioritize efforts in making customer interactions smoother and more efficient.
4. Customer Churn Rate
As the name suggests, this metric measures the percentage of customers who have discontinued their relationship with a company during a specific time period. Also known as Attrition Rate, these numbers give you an insight into the rate at which the company is losing customers.
The formula for calculating churn rate is simple. Divide the total number of customers lost during a period of time by the total customers at the start of the period. Multiply this number by 100 to get your answer.
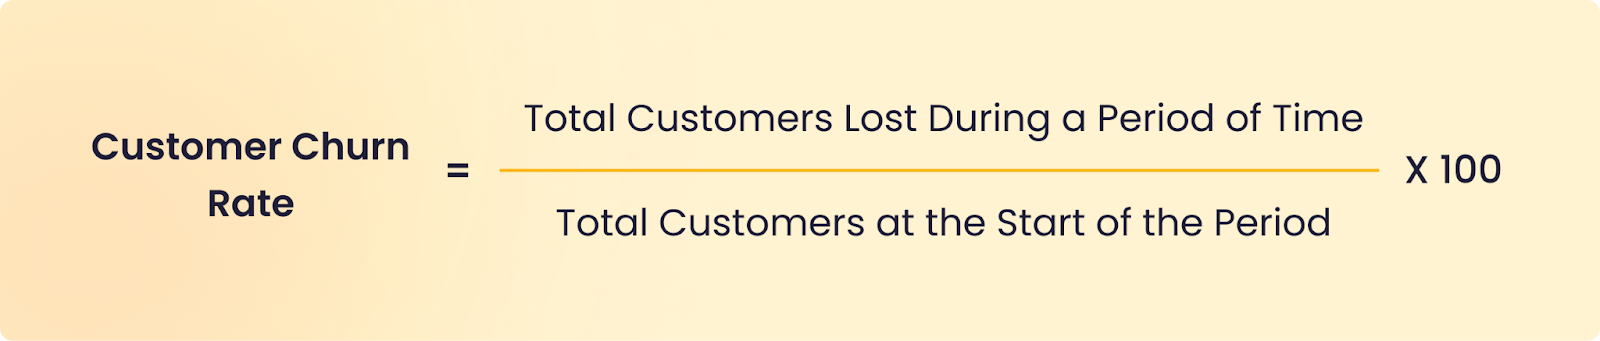
Suppose a SaaS startup had 1000 customers at the beginning of the quarter. During the quarter they lost 50 customers. Then the churn rate for that quarter would be – (50/1000) x 100 = 5%.
Benefits:
- Identify customer attrition and help businesses react proactively to reduce churn.
- Allow companies to assess the effectiveness of customer retention strategies over time.
- Help in forecasting revenue and setting growth targets
Churn rate directly impacts a company’s revenue and growth. High churn rates can indicate issues with customer satisfaction, product quality, or competitive pressures, making it crucial for businesses to monitor and address this metric.
Recommended Read: 11 Ways To Reduce Customer Churn
5. Customer Retention Rate
This customer experience metric is complementary to churn rate and measures the percentage of customers that a company successfully retains over a specific time period. It directly reflects customer loyalty and the overall health of a business. A high retention rate signifies that a company can keep its existing customers engaged and satisfied, which often leads to increased revenue and reduced acquisition costs.
Here’s how you calculate it – subtract the number of customers acquired during a time period from the total customers the company had at the end of that period. This will give you the number of customers that the company retained.
Now, divide this number by the total number of customers at the start of the period and multiply the result by 100.
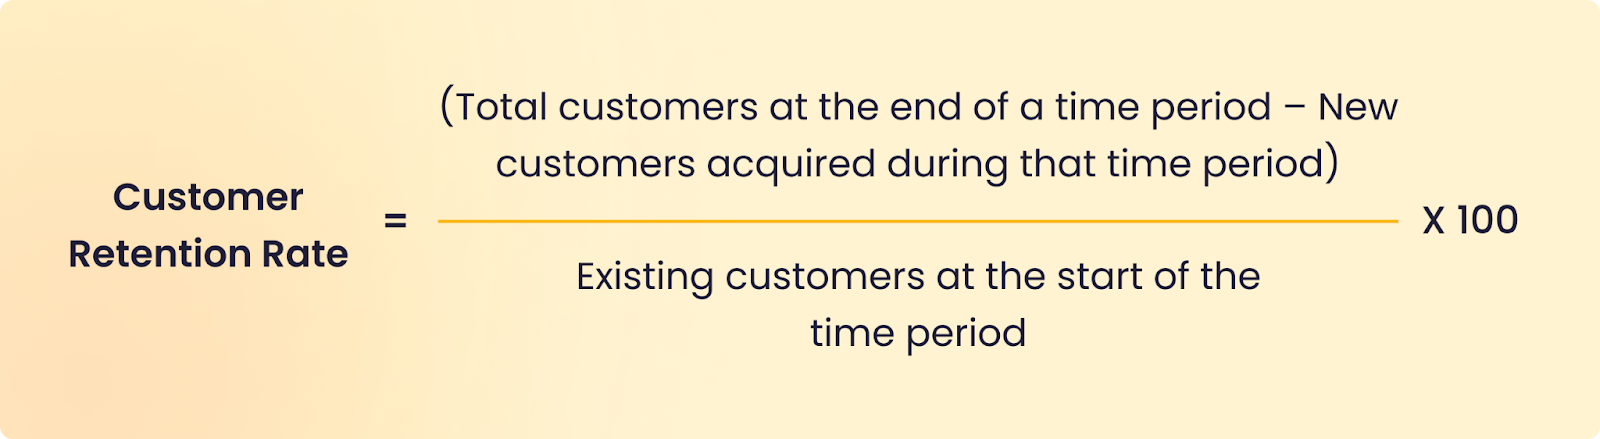
Say a company had 100 customers at the beginning of the quarter. During the quarter they acquired they added 20 customers. However, they still ended the quarter with 100 customers. Their retention rate will be (100-20)/100 X 100 = 80%.
The company retained 80 of their original customers out of 100.
Benefits:
- Provides insights into the effectiveness of customer retention strategies.
- A high retention rate can lead to increased customer lifetime value and sustained business growth.
- Helps in setting realistic growth targets and assessing customer loyalty trends over time.
Recommended Read: Proven Strategies to Improve Customer Retention
6. Customer Lifetime Value (CLV)
Customer Lifetime Value (CLV) is a metric that estimates the total revenue a business can expect to earn from a single customer throughout their entire relationship with the company. CLV takes into account the average purchase value, purchase frequency, and the duration of the customer’s relationship with the business.
It helps businesses understand the long-term financial impact of customer relationships. By knowing the value of each customer, companies can make informed decisions about customer acquisition, retention, and marketing strategies.
The formula for calculating Customer Lifetime Value varies based on the specific business model and industry. However, generally it’s calculated as: (Average Purchase Value × Average Purchase Frequency) / Churn rate.
In the above formula –
- Average Purchase Value: The average amount a customer spends during each transaction.
- Average Purchase Frequency: How often, on average, a customer makes a purchase.
- Churn Rate: The rate at which customers leave your company.
Benefits:
- Helps allocate resources effectively by channeling focus on high-CLV customer segments.
- Guides marketing strategies by determining how much can be spent to acquire new customers.
- Assists in identifying and retaining high-value customers, ultimately increasing revenue and profitability.
Customer Lifetime Value is a vital metric for businesses aiming to maximize the profitability of their customer base.
Recommended Read: 7 Tips to Inspire Lifelong Customer Loyalty
7. First Response Time (FRT)
First Response Time is a key customer experience metric that calculates the total time that’s elapsed from the moment a customer reaches out to you with an issue, till the time a support agent responds to them.
FRT is highly relevant because it directly impacts customer satisfaction. Customers value prompt responses to their queries or issues, and a longer FRT can lead to frustration and dissatisfaction. A quick first response sets the tone for a positive customer service experience.
Calculating your FRT is easy. Take the total of the first response time for all tickets in a set period (say, a month) and divide it by the total number of tickets in that same time period.

Benefits:
- Helps gauge the efficiency of a company’s customer support team in addressing customer inquiries.
- Aids in meeting customer expectations for timely responses.
- Allows organizations to set and track service level agreements (SLAs) for response times.
Recommended Read: Tips on Reducing First Response Time
8. Average Resolution Time (ART)
Average Resolution Time (ART) is a metric that measures the average amount of time it takes for a company’s customer support team to resolve customer inquiries, issues, or requests. It evaluates the efficiency and effectiveness of a company’s customer service operations.
This too, directly impacts customer experience and overall satisfaction. Customers value not only prompt responses (First Response Time) but also quick resolutions to their problems. A longer ART can lead to dissatisfaction and potentially drive customers away.
To calculate your Average Resolution Time, divide the total resolution time of all the tickets you closed in a set period of time (say, a month) by the total number of tickets closed in that time period.

Benefits:
- Helps gauge the efficiency of a company’s customer support team in resolving customer issues.
- Aids in meeting customer expectations for timely problem resolution.
- Allows organizations to set and track service level agreements (SLAs) for resolution times.
Reducing Average Resolution Time is crucial for providing excellent customer service. Quick and efficient issue resolution not only satisfies customers but also enhances their overall experience and loyalty to the brand.
9. First Contact Resolution (FCR)
First Contact Resolution is a metric that measures the percentage of customer inquiries or issues resolved at the first attempt by your support team, without the need for follow-up interactions. FCR reveals the efficiency and effectiveness of your customer support team.
Since prompt issue resolution is the top priority for customers, tracking your FCR is a great way to understand whether or not your customers are having a good experience.
In order to calculate your First Contact Resolution rate, divide the number of issues resolved on the first contact in a specific time period by the total number of inquiries in that time period and multiply by 100.
Say for example – company X receives 1000 customer queries per month. Of these, 700 were resolved in the first interaction and the remaining required follow-ups. The FCR rate for company X will be (700/1000) x 100, which comes out to 70%.
According to the Service Quality Measurement (SQM) Group, the benchmark for a good FCR rate lies between 70-79%. Anything over 80% is considered world-class in this specific metric.
Benefits:
- Reveals the effectiveness of your support teams in handling customer queries
- Is a good indicator of customer satisfaction
10. Trial to Paid Conversion Rate
The Trial to Paid Conversion Rate is a metric that measures the percentage of customers who transition from a free trial or freemium version of a product or service to a paid subscription or purchase.
Whether or not your customers choose to move forward from a free trial of your product to purchasing it tells you how much they like your business. If they had a good experience with your product, it’s highly likely that they’ll buy from you. This is why the Trial to Paid Conversion rate is a metric worth tracking. In a way, it validates your product and tells you whether or not your product appeals to your audience.
To calculate the Trial to Paid conversion rate, divide the number of customers who upgrade to a paid plan during or after a trial by the total number of trial users and multiply by 100.
Say for example, a software company offers a 14-day free trial of its premium software. During that period, 200 users signed up for the trial. Of those 200 users, 50 choose to upgrade to a paid subscription. The Trial to Paid Conversion Rate would be – (50/200) x 100 = 25%.
Benefits:
- Provides insights on the effectiveness of trial offerings
- Directly impacts revenue growth and helps in setting growth targets.
- Informs marketing and product strategies to improve conversion rates.
Getting Started
Remember, if you don’t pay attention to your customers, your competitors definitely will. Now you know the most important customer experience metrics and KPIs to track. All you need to do is get started. With Hiver, you get real-time, actionable insights you can use to improve your customers’ experience.