Table of contents


10,000+ teams use Hiver Analytics to delight customers!

18 Key Customer Service Metrics + How to Use Them

Table of contents
How do you define great customer service? While ‘great’ is a subjective term, there is a way you can measure the quality of your customer service.
Enter customer service metrics.
Even though study after study proves the power of top-notch customer service, most businesses are busy chasing targets in marketing and sales. Since there’s no way to provide a direct correlation between customer service and revenue, customer service teams are often left to operate on a set-it-and-forget-it basis.
However, if you don’t measure your customer service performance at all, how can you iterate and improve? Customer service metrics serve as a guiding light for your team to achieve their maximum potential.
There are two types of customer support KPIs: Operational and Organizational.
Operational metrics measure the performance of your customer service representatives. You’ll find out exactly how many queries they receive, how many are resolved, and so on.
Organizational metrics probe into the customer’s mind. What do they think about your product? How happy are they using it? While the customer service team does have a role in influencing these metrics, in essence, here’s where your entire organization can pitch in.
After all, no matter which department they work in, superior customer experience should be an organization-wide goal.
We’ve covered the 18 most important metrics you need to track to keep your customer service at its best.
With every metric, we’ve also provided a handy ‘Use This’ section, so you know exactly what to do once you have the numbers.
Let’s dive in.
Table of Contents
Operational customer service metrics
Operational customer service KPIs, as the name suggests, provide data on your customer service team’s performance in terms of efficiency and speed. These metrics focus purely on numbers, such as how many emails you receive per day, how many calls you answer, the rate of response, and so on. Look closely, and you’ll find out how well your customer service team is performing.
1. Average Issue Count (Daily/Weekly/Monthly)
No matter how good your product quality is, you’re bound to receive a certain number of complaints from your customers. Calculating the average number of daily, weekly, and monthly cases will help you in a number of ways.
First of all, you’ll be able to work out the standard counts for different months. This will help you create benchmarks for your company staff. Secondly, you’ll be able to identify frequently occurring issues and determine whether they can be automated or not.
Depending on the volume of support tickets you receive, you’ll want to allocate a specific period (say a week or a month) and keep track of the cases you receive in that period.
How to use it:
As your company grows, so will your customer count and, inadvertently, your support requests too. However, with product iteration and proactive support, it is possible to decrease your ticket count as you grow.
Ticket volumes reveal data about your busiest hours, days, weeks, and months. For instance, you might find a surplus in the number of cases each time you release a new feature. Or when you offer a big discount on your product. You want to ensure your team is prepared for such instances. It helps to monitor ticket counts and be mindful of trends you see. “Average count” reveals data about various different departments.
- If you receive a number of service-related tickets, you’ll want to track the reasons and relay the findings to your team.
- If most of your tickets are based on product-related issues, then you need to spend more time polishing your product.
2. First Response Time
First Response Time is the time (minutes, hours, or days) between when a customer first sends a message and when a support representative provides their first reply. This indicates the amount of time the customer has to wait before she is helped.
According to Hiver’s Customer Service Benchmark Survey, 34% of customer service teams have a First Response Time of under 60 minutes for email queries.
The first response time of your service staff is a crucial customer service metric. They usually vary with the number of customers you have.
Companies that really care about their customers have quick first response times and bind their service staff to approach clients as soon as possible. The first response has the same effect on your customers as first aid. It gives immediate relief and buys you additional time to understand and resolve the customer’s issue.
Many Saas customers, however, expect quicker responses from their service providers. As a result, reports show that 48% of support teams keep their First Response Time below 1 hour. Only 6% of businesses have an average response time of over 24 hours.
How to use it:
To set the right expectations, mention a specific time in your automated email and website when customers first contact you. For instance, you may state on your website that customers can expect a response within 24 or 48 hours.
Next, set an internal goal for your team that they must adhere to. If your team constantly falls short of responding during the given time, find out why. Are they receiving more tickets than they can handle? Are your processes in place? Do you need more members on the team? Fix whatever bottlenecks you find, and your first response times will eventually improve.
Reduce your First Response Time with SLAs
3. Average Resolution Time
Customer satisfaction depends largely on this metric. Every customer wants a seamless and smooth support experience. Average ticket resolution time is the total time that is taken by the support team for solving the issue once it is looked upon. Efficient teams focus more on the resolution time rather than the reply time.
A great indicator of the efficiency of your customer service staff is the average time they take to resolve an issue. Having quick first response times is fine, but if you take too much time in resolving the customer’s concerns, it will eventually hurt the customer experience.
But quick issue resolution times can mislead you as well. It’s a known practice among many service-based companies where the support staff tags tickets as resolved without actually resolving the issue completely, only to meet their targets.
How to use it:
If the average issue resolution time runs high, you’ll need to investigate the underlying problem.
There could be a lack of coordination between the service and technical teams, or your service staff might need training in handling more complex queries.
Spending some time improving your average resolution times can result in a huge boost in customer satisfaction.
4. Number of Interactions per Case
This metric identifies the number of interactions the support representatives and the customers have around a single issue before coming to a resolution. Alternatively, you can also measure the First Contact Resolution rate, which keeps track of your support rep’s success rate in resolving the query in the first interaction with the customer.
This metric measures the efficiency of a particular team to resolve a particular issue on the first interaction. It shows how good the support executives are at addressing and understanding a given problem without needing multiple interactions.
In a utopian world, the ideal number of interactions per ticket is 0. Because you’d ideally want to resolve customer issues even before they arise. But for operational purposes, you still need to define an ideal number of interactions in which you’d want to resolve your customers’ issues.
Too many interactions can often mean that your support staff is not asking the right questions about the customer’s issue, or the customer is not being directed to the right people. So if you see the average number of interactions per issue rising, you may need to look closely and find out the reasons for it.
How to use it:
Solving issues without multiple interactions is a skill each of your executives must acquire. First off, you want to make sure you’re not making your customers wait for your response. Canned responses for live chat are helpful in acknowledging their queries right away and equip your agents in delivering prompt responses to repetitive queries.
Secondly, you want to make sure queries are not passed around and addressed as soon as possible.
When solving a query, representatives should try and understand the problem right away. If they find essential information missing, they might want to make a list of questions to ask and then suggest a solution.
It’s important not to ask obvious questions, answers to which might already be available in the company database. Customers appreciate it when representatives do their homework.
You can also provide reps with additional training with the help of live chat scripts and customer surveys. In order to assess whether your representatives are doing a good job, use tools such as Lessonly, which allows for practice-based learning.
5. Issue Resolution Rate
This is another important customer service metric that needs to be monitored closely at the operational level. It represents the percentage of issues your staff actually resolves from the total queries received.
Again, this requires strong QA at the back-end to ensure that the issues are actually being resolved. A rising resolution rate is a clear indication of the efficiency levels of your staff.
How to use it:
While the ideal issue resolution rate is 100%, there will always be issues your team cannot resolve. For every unresolved issue, you’ll want to look closely at the reasons for it.
Whether it was a feature you’re not ready to release or unresolved technical issues, be sure to address the problem. No matter what, provide the customer with some sort of resolution at the end of your interaction.
For instance, if it’s a feature you’re not ready to release yet, be sure to let the customer know gently that you’re not planning to roll out the feature anytime soon.
Certain issues can only be resolved when the customer takes a specific action. If they fail to do so, see if it’s possible for you to do those actions from the backend, so their issue is resolved. More often than not, customers will prefer you do this.
6. Self-Service Usage
Most customers would rather resolve issues on their own than speak to a customer support agent. This is where self-service tools come in handy.
The more customers use your self-help channels, the better it is for your company. Self-service usage helps your customer service team focus on more complex issues rather than answering the same set of questions over and over. It might also help you to keep your customer service team lean if you only get a few requests per day.
It is easy to track the usage of the self-help tools on your website, as well as social media. If you find more customers accessing your knowledge base than reaching out to you by phone or email, consider it a job well done.
How to use it:
Be sure to keep your self-service tools up-to-snuff, on your website as well as social media. Use modern tools such as chatbots and interactive voice technology to help customers solve their queries without getting in touch with you.
Create a knowledge base that’s accessible, comprehensive, and easy to navigate. To understand if your knowledge base is effective, measure metrics like page visits and contact rate. Page visits tell you which sections of the FAQs do your customers visit more frequently.
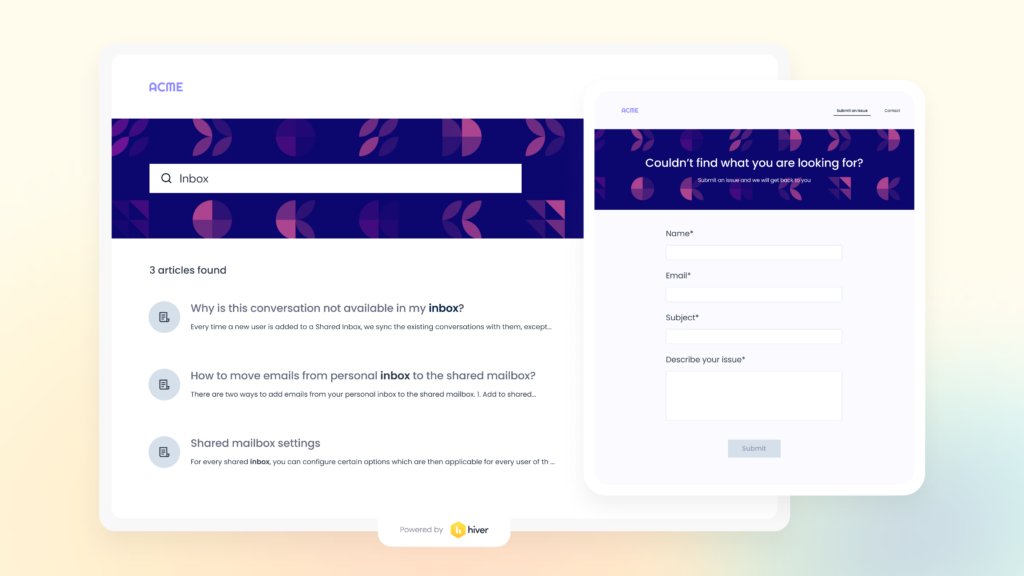
You can also measure contact rate with reference to the traffic generated from your knowledge base pages. If there’s a decrease in contact rate due to an increase in knowledge base page traffic, then it’s safe to assume that your self-help documentation is working.
Related reading you may like: How to create a knowledge base
7. Preferred Communication Channel
This is an operational customer service metric that has huge organizational implications. It effectively tells you about the general preferences of your customers.
According to research by eConsultancy, US consumers prefer support from the following channels: Phone support (61%),email (60%),Live Chat (57%),online knowledge base (51%),“click-to-call” support automation (34%).
But this rate varies according to the nature of your business. Your customers might even reach out to you via social media. So, you need to track how your clients contact you and then optimize those channels for an improved service experience.
With a number of emerging technologies, it’s easy for businesses to use multiple channels of communication. However, the key is to assign the right number of customer service representatives to each channel. This way your customers never go unanswered.
How to use it:
Once you know your customers’ preferred channel for communication, be sure to optimize those channels, assign more team members to them, and develop processes to ensure that requests are answered in a timely manner.
For example, if you find more people reaching your business via phone, you need to ensure your business phone system is in top shape. Set up features like auto-attendant, call routing, IVR, and others to ensure your inbound callers have their issues resolved quickly and efficiently.
If a channel does not receive as many requests, see if it is possible to set up alerts. This way, you don’t have to constantly man the channel.
Also, since 63% of customers choose live chat to contact businesses, you’d definitely want to consider setting up a chat channel to enhance accessibility.
Get a live chat application that lets you
- Capture the customer’s name and email to help you deliver personalized support
- Save previous chat transcripts for future reference and better context for other agents
- Update business hours and inform customers when your agents are available
- Capture CSAT ratings at the end of the chat
- Track agent performance with relevant metrics like chat volume and average response times
And if want to offer 24/7 support but you’re limited on agent availability, you can always set-up automated replies with AI bots for easy-fix issues.
8. Rate of Answered Calls
The rate of answered calls is another metric that helps measure your team’s efficiency. Simply put, it refers to the number of calls answered in comparison to the number of calls received by your customer support center.
Companies with higher rates of answered calls are evidently able to solve more customer queries than those with lower rates. A high rate of missed customer calls indicates more customers with negative experiences and below-par efficiency on the part of your team.
To calculate the rate of answered calls, simply divide the number of answered calls by the total number of calls. For example, if a company receives 100 calls in an hour, of which 10 are unanswered, the answered call rate is 90%.
Customers that are unable to speak with agents are likely to get more frustrated and build a negative opinion of the company.
How to use it:
The average rate of answered calls is directly linked to how quickly customer service agents answer calls and resolve issues. A low rate could be an indicator that you need more customer support agents to handle a large number of calls.
9. Average Handle Time
Average handle time refers to the time a customer spends on the phone with a customer support agent. It is a useful measure of the efficiency of the team.
Make note that average handle time does not include the time a customer spends in a queue or before the call is received. It only includes average talk time, average hold time, and total time taken for after-call tasks.
In order to calculate average handle time, simply add the three, and divide it by the total number of calls you get.
Quick average handle times can be harmful if your executives are simply trying to hang up calls and not resolve issues fully. While it is good to close customer service requests as quickly as possible, you don’t want to compromise quality for speed.
To calculate average handle time for email, add up all the minutes – starting from opening the email, to responding to follow-ups, to finally resolving it – and divide it by the total number of tickets received. Accordingly, you can gauge if you need to reduce your email resolution time.
How to use it:
Average handle time can be a misleading metric if not used properly. It is important to strike a balance between the speed with which a query is handled and the quality of service provided.
Even if it increases average handle time, support team members should aim to resolve a customer’s problem to the best of their ability.
10. Backlog
Customer service requests that have accumulated over a period of time are termed backlog. Needless to say, every company must aim to keep this number at a minimum. The more your backlog, the more irate customers you’ll have to deal with.
Queries remain unresolved for a bunch of reasons. It could be that you’re experiencing a high volume of messages, or your customer service team is not performing the best job. It could also be that your team is taking longer to resolve product issues than expected.
To calculate the backlog of issues, first, decide on a reasonable time frame for resolving issues. It could be 24 hours or a couple of days. Next, take a look at how many tickets are open longer than this period. This is your backlog.
Backlog is an essential metric, as it helps measure your customer service team’s performance and their ability to resolve issues in time.
How to use it:
- If the number of tickets you resolve per day remains the same, but your backlog increases over time, it is time to add a new customer service executive to the team.
- If the reason for the high backlog is slow responses from your product team, you need to put a better system in place to handle product requests and issues.
Organizational customer support metrics
Organizational support metrics reflect the performance of your entire organization, and not just your customer service representatives.
These metrics show you the overall performance of your product and brand, in terms of how customers feel when they engage with your business, and how likely they are to recommend your services to others.
11. Customer Satisfaction Score (CSAT)
Customer satisfaction or the CSAT score is another key performance indicator that you need to closely track and monitor. Satisfaction is often a subjective metric and doesn’t always show you the full picture. You need to use it in combination with other customer support metrics to make sense of it.
For example, if the satisfaction rating for a customer is high but the NPS rating is low, you’ll need to dig deeper to find out the reasons for it.
To track customer satisfaction, you’ll need to use a combination of surveys, and quick feedback ratings every time a customer makes a purchase or visits your website.
Useful resource: Survey Monkey has a detailed manual on how companies can create effective survey questions. We recommend using it as a guideline when creating your customer satisfaction surveys.
You can match your results with your industry benchmarks. For example, according to The American Customer Service Index, the average customer satisfaction rating in the internet retail industry for 2014, is 82% in the US. For the internet service provider industry, this rating is 64%.
How to use it:
A low customer satisfaction score can be a combination of various reasons. To find out, add follow-up questions to your surveys. For instance, if a customer provides a rating of less than 6, ask them what went wrong. Try to provide multiple choices to choose from such as product features, customer service, user interface, and so on, so customers can answer with a click.
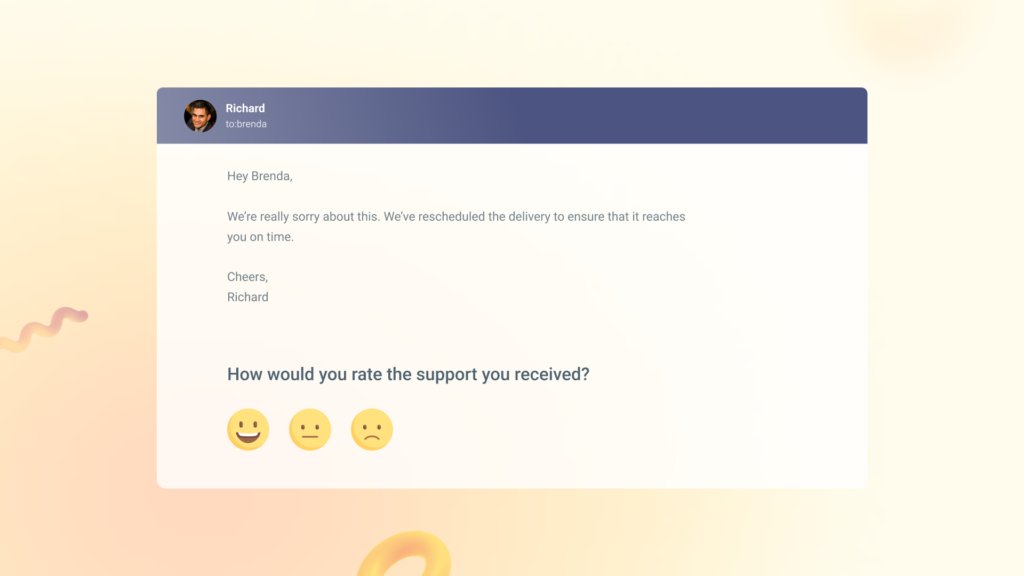
Quick tip: Hiver helps you measure the quality of your customer support with CSAT surveys at the end of every conversation. It’s non-intrusive and does not break the conversation.
12. Net Promoter Score (NPS)
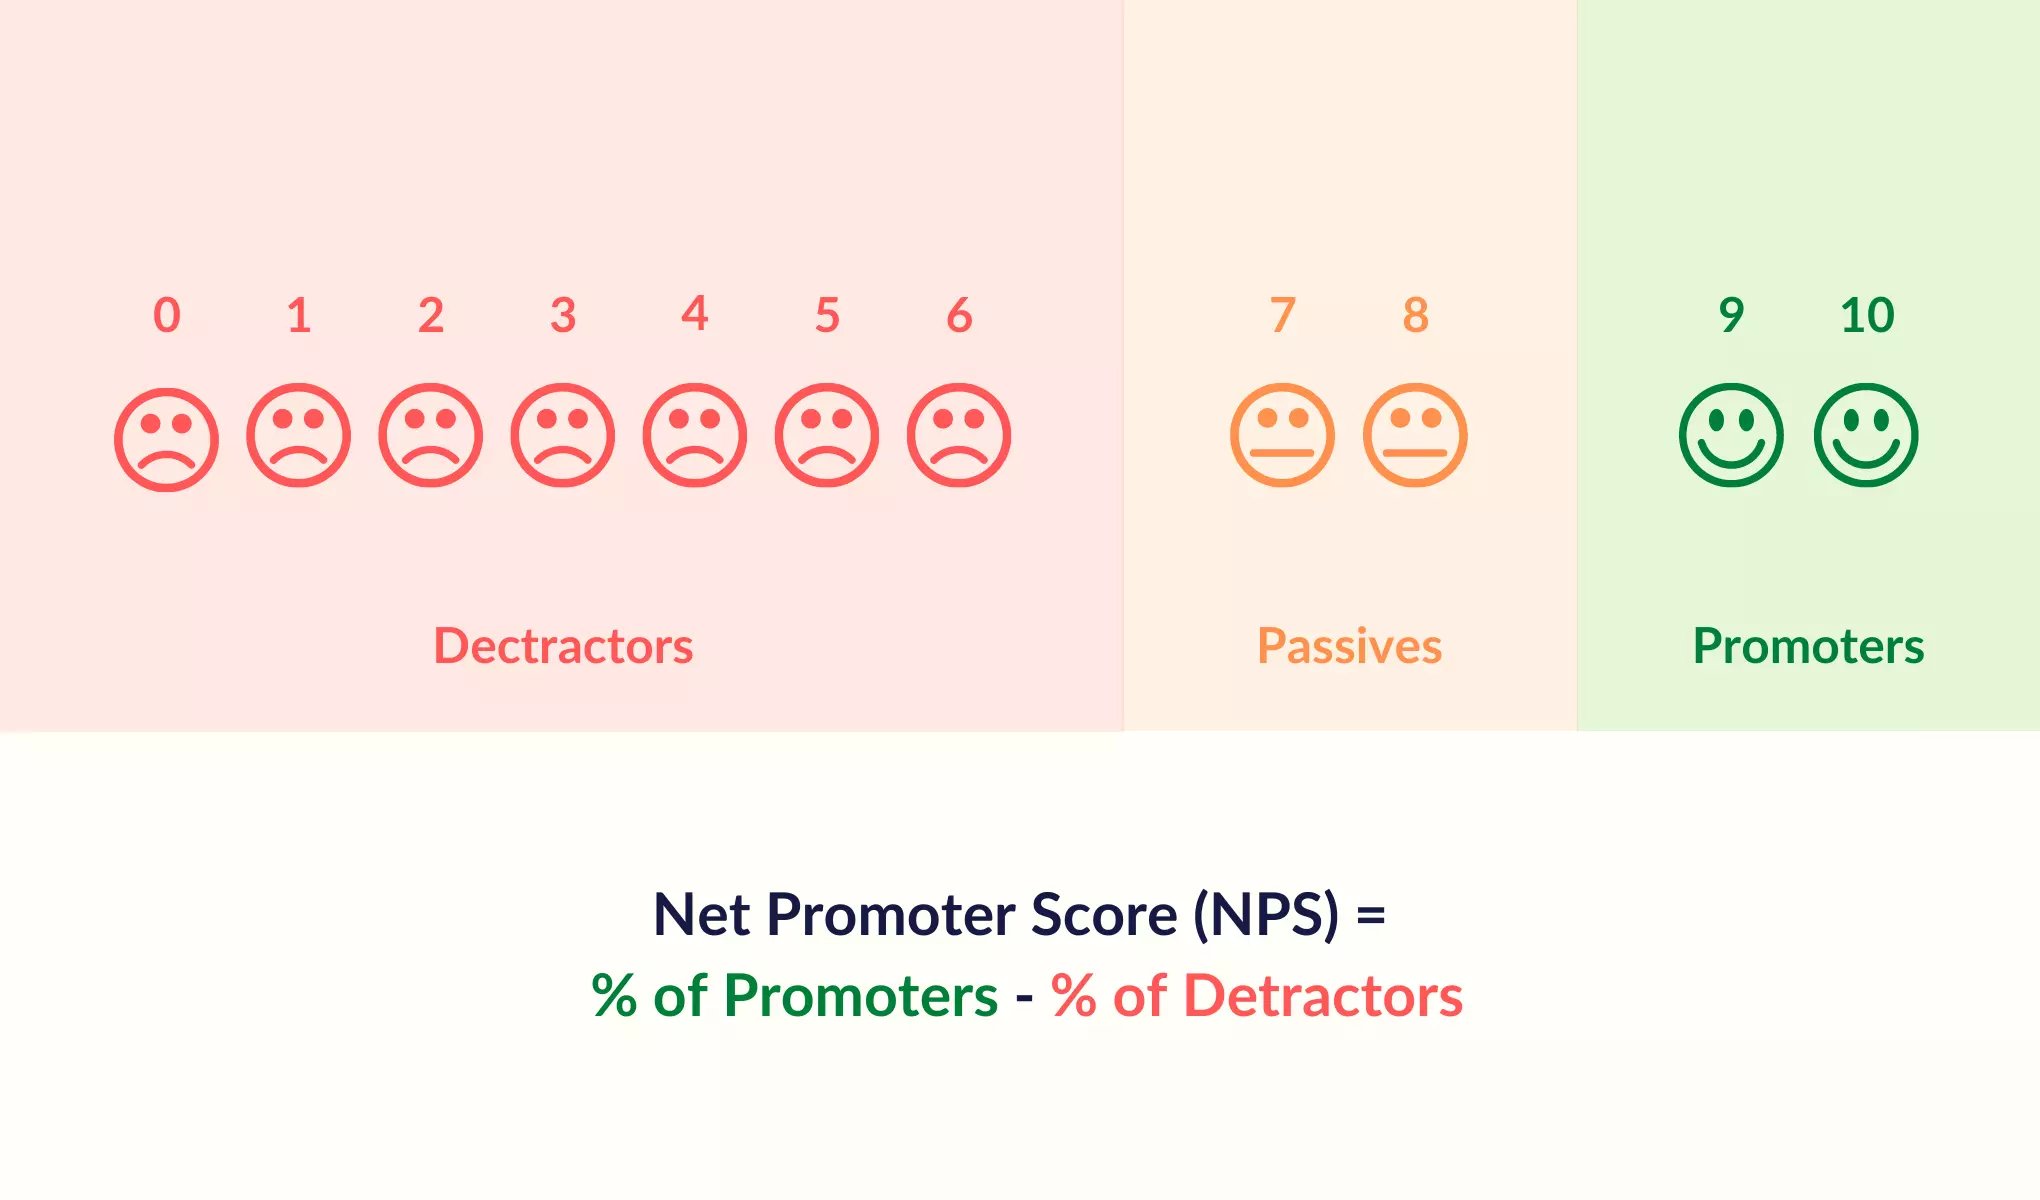
NPS or Net Promoter Score is a commonly used metric to measure how likely customers are to recommend you to friends, family, and colleagues.
One of the best indicators of the strength and effectiveness of your customer service is the word of mouth it generates for your business. The Net Promoter Score (NPS) calculates just that. It’s often a simple question that asks your customers about the likelihood, on a scale from 0 to 10, of them referring your services to their friends.
To give you an idea, companies like Apple (iPhone) and Amazon recorded NPS scores of 68 and 62 respectively.
To make this customer support metric even more actionable, also add a quick question about the reasons behind your customers’ response. This will help you find out the exact areas that need to be improved. You can use tools like Promoter.io, ProProfs Survey Maker, and Qualaroo to measure NPS easily.
At the organizational level, the NPS metric will give you a strong sense of how satisfied the customers are with your product/service. This will also play a key role in your marketing campaigns.
How to use it:
Customers with responses from 9-10 are classified as promoters, 7-8 as passives while the ones below 6 can be categorized as detractors. You can calculate the NPS by subtracting detractors from promoters.
There could be various reasons why your NPS is low, but first, you’ll want to start investigating your product itself. To uncover further reasons, you’ll also want to check out other customer service metrics for your company.
13. Frequency of Up-sells and Cross-sells
The boundaries between sales and services departments have blurred for modern-day businesses. That is why upselling and cross-selling have become important customer service metrics for many organizations.
Upselling is when you convince your clients, often with high-quality service delivery, to opt for a higher-priced version of your product. Upselling works best if offered to customers that truly need the additional features in your product. If added features do not add much value for a customer, they are unlikely to buy.
Cross-selling is when you convince the clients to purchase a complementing product to the existing product/service they have.
Higher upselling and cross-selling rates mean your service departments are doing an exceptional job and successfully convincing customers to spend more on your products. This eventually improves the per customer dollar value, another key organizational KPI.
How to use it:
- Keep a track of the most requested features by your customers, and provide those features to clients who upgrade.
- Keep a track of your power users, and get their thoughts on features they would be most likely to pay for.
14. Customer Experience Rating
Almost 90% of American consumers are prepared to spend more money for a superior customer experience. More than your advertisements and your claims about your product, customers remember their experiences of using your product and interacting with your service staff.
Customer experiences are built upon small things like the tone of your service staff, how they write emails, their eagerness to resolve customer issues, the concern and understanding of the service staff, and the time it takes to resolve their queries.
This is a key customer service metric, as it ultimately impacts your customer retention, upselling/cross-selling, and satisfaction rates.
You can measure customer experience using a combination of transactional surveys and in-person feedback. Once you have a sense of customers’ needs, you can tweak your customer service strategy accordingly.
How to use it:
Use a mix of channels to gauge customer experiences: social media, email, phone calls, and even face-to-face meetings. Once you have enough data, find out what the strengths and weaknesses of your business are, and work on them accordingly.
15. Customer Retention Rate
The probability of selling to an existing customer is 60-70%, much higher than the 5-20% probability of selling to a new prospect. This clearly suggests that retaining your customers is absolutely crucial, not only for your sales figures but also for your brand image and per customer dollar value.
Customer retention comes with delightful customer experience and customer service. Creating a good experience, that is predictable and consistent will undoubtedly improve customer retention. Your customer support team has a major stake in customer retention, and that is why you need to monitor this customer support metric from their perspective. Once a sale has been made and the customer is on board, their major contact point is your service staff.
A rising retention rate means that your services team is doing a great job. A decline, on the other hand, means that things are not working as they should. Retaining existing customers for the longer term shows that a business has developed loyalty and trust.
How to use it:
A low customer retention rate can spell doom for your product, if not fixed. Take a look at how you can boost customer retention: Based on their usage of your product, customers can generally be classified as new users, occasional users, and power users. To engage each of these customers, you’ll have to employ different strategies.
For new users, you want to ensure they see your product’s value the moment they use your app for the first time. Don’t confuse or frustrate customers with a lengthy sign up. Instead, lead them to accomplish what your product is supposed to do, as quickly as possible.
For occasional users, you want to constantly boost them with timely win-back notifications, progress reports, blog posts, and offers. If customers still end up leaving, make sure you find out the reason, either by speaking with them on the phone, email, or text.
Power users can help increase your customer retention by becoming product advocates. Ask for their feedback on new and old features. You can also engage with them through social communities, and offer them additional features to make them your strongest ambassadors.
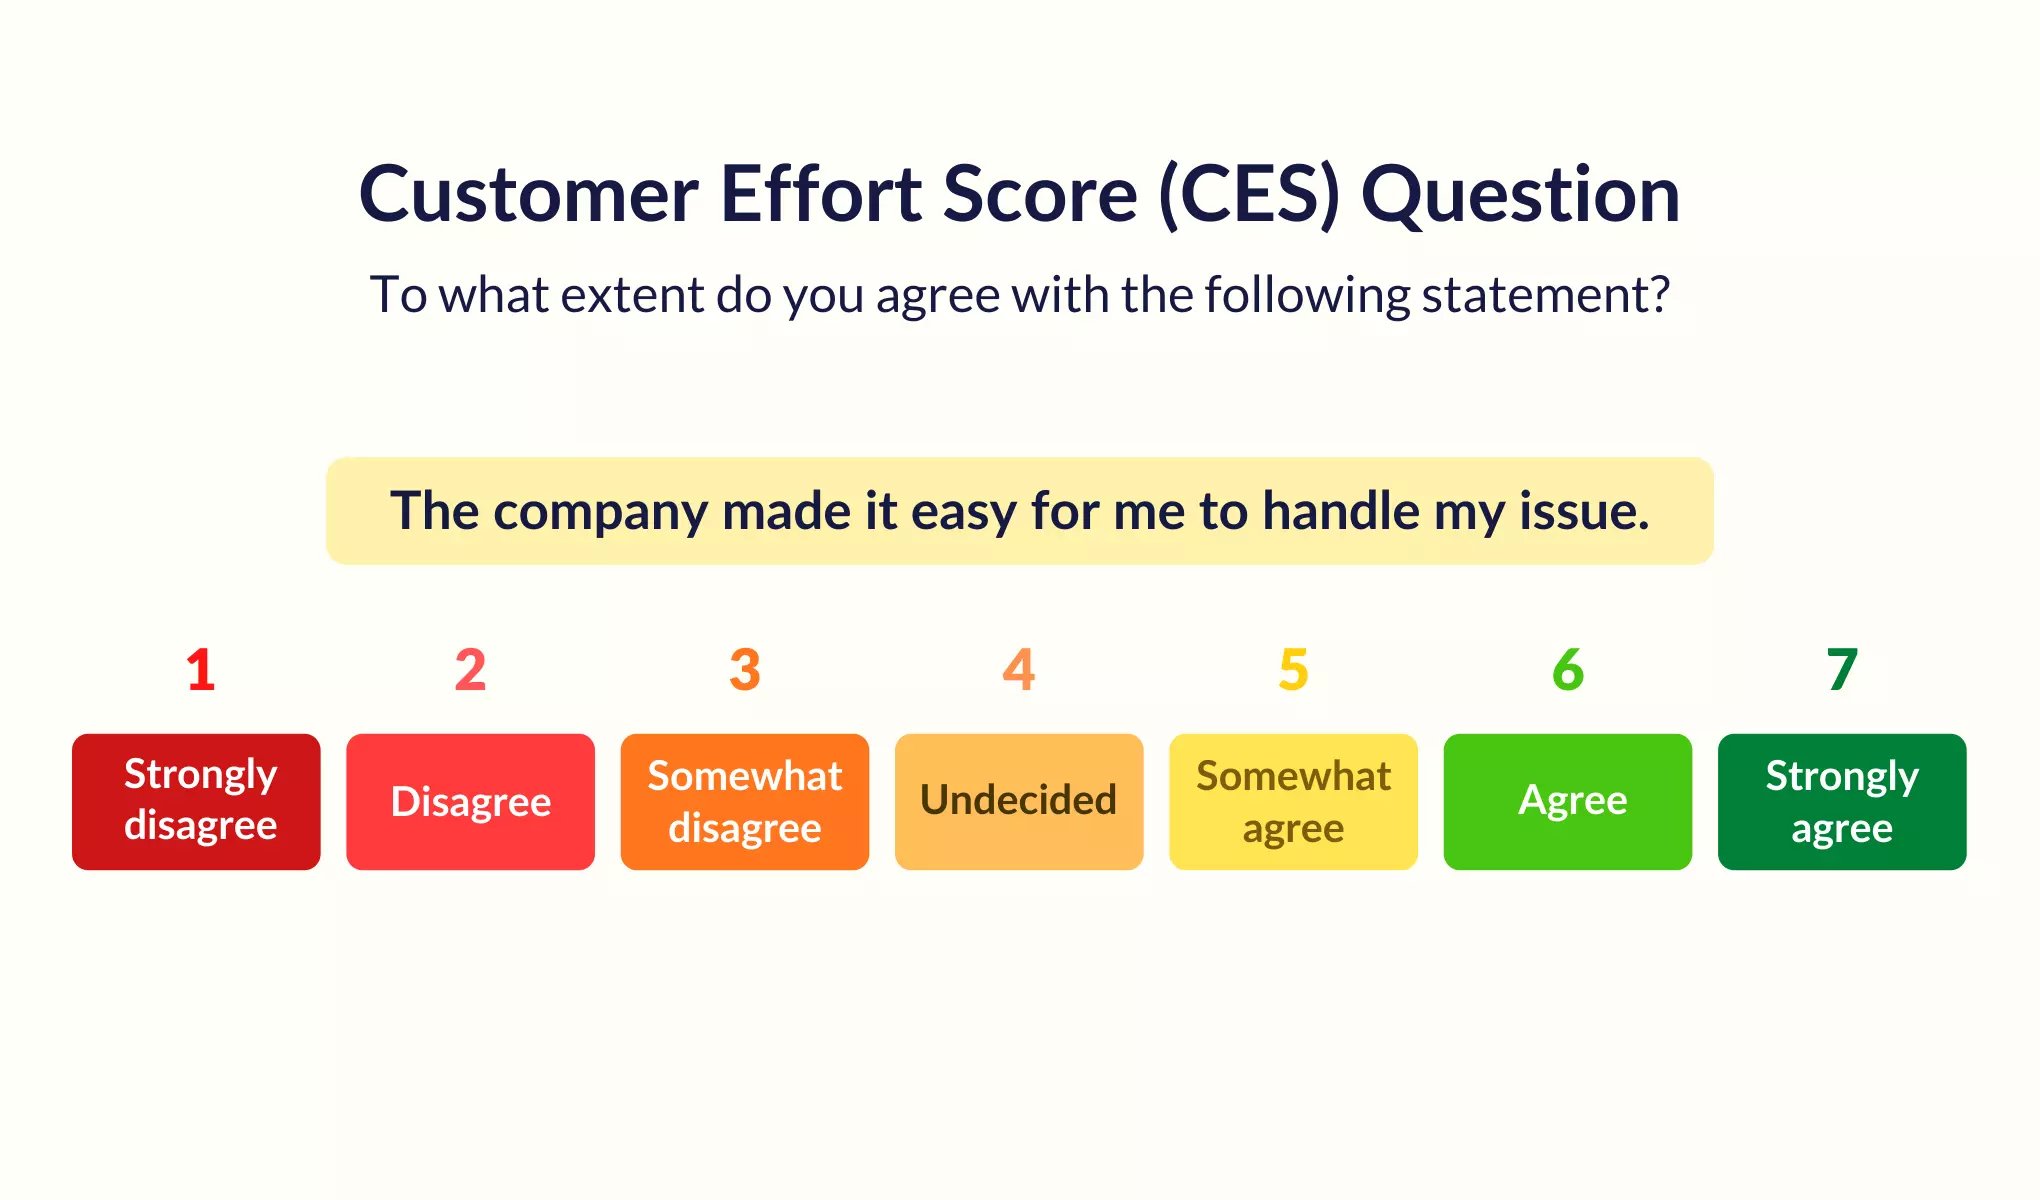
16. Customer Effort Score (CES)
Similar to customer experience, the customer effort score measures how much effort a customer has to put in to use your product. You may have seen these questions asked at the end of your shopping sessions on an eCommerce app. They may ask how easy it was to place an order or initiate an exchange. The purpose of these questions is to measure how simple it is for a customer to use a service.
The more frictionless and easy it is to use an app, the more likely customers are to continue using it.
Customer effort scores are generally the result of a single question, asking the customer how easy it was to use the product on a scale of 1-7, ranging from Very Difficult to Very Easy.
How to use it:
If your customer effort scores are generally on the lower side, you might want to break down the steps it takes to use your product and evaluate each on an individual basis. For more complicated services, you might want to add a customer effort survey at the end of major milestones to get a better idea of where customers might be facing the most difficulty.
How to improve customer effort score
Customer effort scores reflect the amount of work a customer has to put in to use your product, get in touch with you, and offer feedback. To lower this score, first and foremost, you’ll want to analyze every step in the customer journey.
- What platform is your product offered on?
- What steps are required to use your product?
- What should the customer do to derive value from the product?
Once you have answers to these, then optimize every step of the way.
Let’s say your product allows customers to buy groceries online. You’ll want to spruce up both the website and app where customers can place an order. Take a look at all possible customer touchpoints, right from your welcome screen to your search bar where customers can find products, and ensure every element of your app is user-friendly.
If a customer has found the product they need, they should experience a seamless checkout process. To help them do this, simplify your payment system. After their purchase, offer timely updates about their purchase.
Aside from making it easy to use your product, you also want to ensure your customer service channels are always open. At any point in time, customers should be able to get in touch with you. This can be either by email, live chat, phone, or text messages.
Other than this, you also want to ensure your self-help documentation is updated. The goal is to help customers solve issues as quickly as possible.
17. Customer Churn
This happens when subscribers or customers stop doing business with a service or company. Customer churn is never good news, but all the same, it is an important metric that needs to be tracked.
Acquiring new customers is a lot more expensive than retaining old ones. So when customers leave, it can be a cause of worry. Reducing churn should naturally be a priority for every business.
Depending on your industry and service offered, you’ll want to allocate a specific time period to measure churn. A social media company, for instance, might measure churn every day. On the other hand, a real estate company will measure churn every year.
How to use it:
Customer churn could be a result of several factors. To get an initial idea as to why customers leave, take a look at all your customer service metrics and the general sentiment of customers in surveys. If possible, try to get on the phone with irate customers and get a deeper sense of the problem.
18. Repurchase Rate
Repurchase rate is an often overlooked customer service metric. Sure, a number of factors could affect why a customer does not do business with your company again, but a great customer experience is certainly a top reason for repeat business from customers.
Repurchase rate is generally used by companies that do not have a subscription model, such as e-commerce companies or consumer product businesses.
Let’s say you have 100 customers, of which 60 made at least two purchases from you in a given period of time. This means the repurchase rate is 60% (60/100 * 100) for that period of time.
How to use it:
Great customer service and experiences go a long way in encouraging customers to do business with your company again. Make sure to go out of your way to provide an exceptional experience to your customers.
Here are some ways you can provide a stellar customer experience:
- Personalize your offerings
- Fulfill unusual and difficult customer requests, such as meeting an unrealistic deadline.
- Make sure your customer support is top-notch and every customer query is resolved.
- Make note of every bug and reported problem, and boost your overall product experience.
- Send handwritten thank-you notes to loyal customers.
- Constantly work on making your product superior to its last version.
This could mean adding more personalization to your offerings, fulfilling unusual customer requests, and offering stellar customer support.
Wrapping up
You can’t improve your service standards unless you know where you currently stand. By measuring the right customer service metrics, you’ll get a clear understanding of your existing service standards and how you compare them with the industry benchmarks.
Once you have these numbers on your dashboard, you can make calculated moves to improve each metric and enhance the overall performance and service standards of your company.